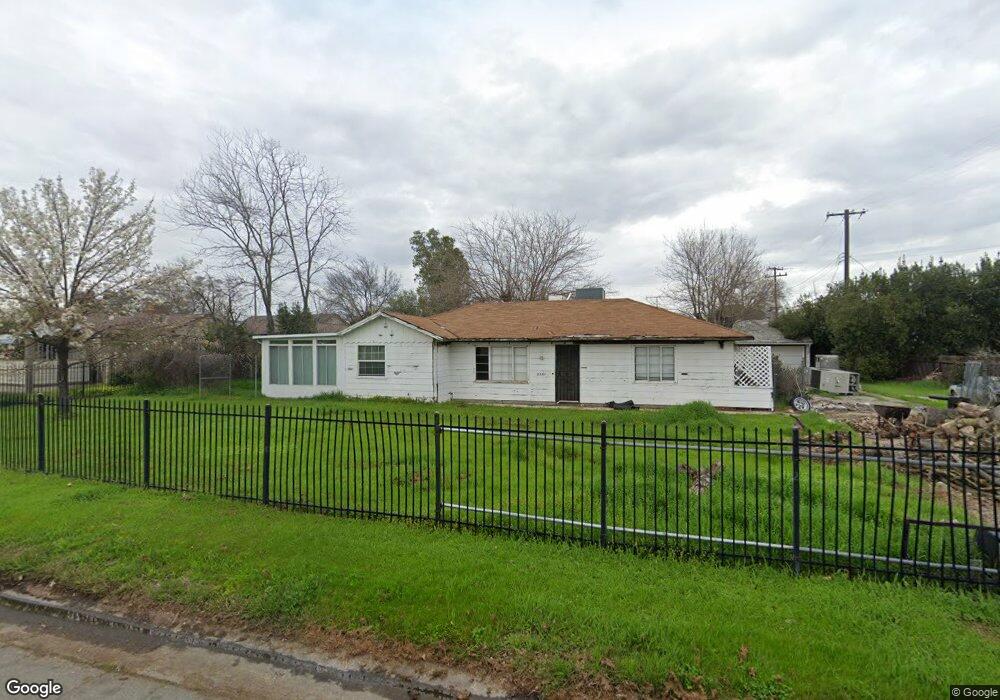
2261 Pyramid Way Sacramento, CA 95821
Bellview NeighborhoodEstimated Value: $311,000 - $434,000
2
Beds
1
Bath
1,124
Sq Ft
$335/Sq Ft
Est. Value
About This Home
This home is located at 2261 Pyramid Way, Sacramento, CA 95821 and is currently estimated at $376,499, approximately $334 per square foot. 2261 Pyramid Way is a home located in Sacramento County with nearby schools including Dyer-Kelly Elementary School, Encina Preparatory High School, and Aspire Alexander Twilight College Preparatory Academy.
Ownership History
Date
Name
Owned For
Owner Type
Purchase Details
Closed on
Sep 29, 2025
Sold by
Johnson Clarence and Clift Suzanne
Bought by
Clift-Johnson Family Trust and Johnson
Current Estimated Value
Purchase Details
Closed on
Mar 14, 2016
Sold by
Catellier Andre K
Bought by
Johnson Clarence and Clift Suzanne
Purchase Details
Closed on
Oct 16, 2015
Sold by
Patrick Dominique C
Bought by
Catellier Andre K
Purchase Details
Closed on
Jun 9, 2006
Sold by
Jacinto Dolores E and Jacinto Family Revocable Trust
Bought by
Catellier Andre K and Catellier Patrick Dominique
Home Financials for this Owner
Home Financials are based on the most recent Mortgage that was taken out on this home.
Original Mortgage
$232,875
Interest Rate
6.57%
Mortgage Type
Purchase Money Mortgage
Create a Home Valuation Report for This Property
The Home Valuation Report is an in-depth analysis detailing your home's value as well as a comparison with similar homes in the area
Home Values in the Area
Average Home Value in this Area
Purchase History
| Date | Buyer | Sale Price | Title Company |
|---|---|---|---|
| Clift-Johnson Family Trust | -- | None Listed On Document | |
| Johnson Clarence | $160,000 | First American Title Company | |
| Catellier Andre K | -- | None Available | |
| Catellier Andre K | $310,500 | Alliance Title Company |
Source: Public Records
Mortgage History
| Date | Status | Borrower | Loan Amount |
|---|---|---|---|
| Previous Owner | Catellier Andre K | $232,875 |
Source: Public Records
Tax History Compared to Growth
Tax History
| Year | Tax Paid | Tax Assessment Tax Assessment Total Assessment is a certain percentage of the fair market value that is determined by local assessors to be the total taxable value of land and additions on the property. | Land | Improvement |
|---|---|---|---|---|
| 2025 | $2,302 | $189,400 | $82,861 | $106,539 |
| 2024 | $2,302 | $185,687 | $81,237 | $104,450 |
| 2023 | $2,243 | $182,047 | $79,645 | $102,402 |
| 2022 | $2,231 | $178,479 | $78,084 | $100,395 |
| 2021 | $2,193 | $174,980 | $76,553 | $98,427 |
| 2020 | $2,152 | $173,187 | $75,769 | $97,418 |
| 2019 | $2,108 | $169,792 | $74,284 | $95,508 |
| 2018 | $2,077 | $166,464 | $72,828 | $93,636 |
| 2017 | $2,062 | $163,200 | $71,400 | $91,800 |
| 2016 | $2,513 | $210,162 | $75,058 | $135,104 |
| 2015 | $2,264 | $189,336 | $67,620 | $121,716 |
| 2014 | $2,155 | $180,320 | $64,400 | $115,920 |
Source: Public Records
Map
Nearby Homes
- 2265 Marconi Ave
- 2155 Whippoorwill Ln
- 2137 Marconi Ave
- 2133 Marconi Ave
- 2931 Wright St
- 2620 Darwin St
- 2849 Aurora Ave
- 2257 Edison Ave
- 2115 Ruby Ct
- 2513 Anna Way
- 2416 Wulff Ln
- 2520 Carson Way
- 2410 Post Oak Ln
- 2500 Ethan Way
- 2012 El Camino Ave
- 2433 Gwen Dr
- 2550 Carson Way
- 1923 Juliesse Ave
- 2436 Connie Dr
- 2405 Ethan Way
- 2251 Pyramid Way
- 2271 Pyramid Way Unit A & B
- 2271 Pyramid Way
- 2801 Bell St
- 2771 Bell St
- 2245 Pyramid Way
- 2811 Bell St
- 2751 Bell St
- 2272 Pyramid Way
- 2264 Pyramid Way
- 2258 Pyramid Way
- 2821 Bell St
- 2731 Bell St
- 2241 Pyramid Way
- 2248 Pyramid Way
- 2240 Pyramid Way
- 2831 Bell St
- 2711 Bell St
- 2280 Pyramid Way
- 2235 Pyramid Way