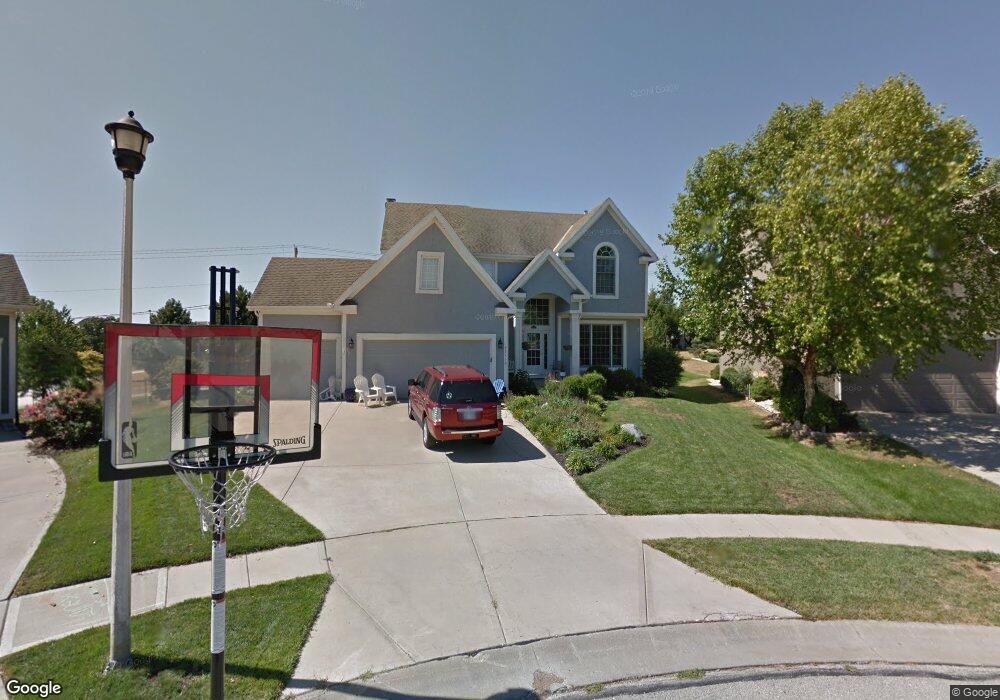
22615 W 46th Terrace Shawnee, KS 66226
Estimated Value: $519,000 - $570,000
4
Beds
4
Baths
2,755
Sq Ft
$197/Sq Ft
Est. Value
About This Home
This home is located at 22615 W 46th Terrace, Shawnee, KS 66226 and is currently estimated at $542,703, approximately $196 per square foot. 22615 W 46th Terrace is a home located in Johnson County with nearby schools including Riverview Elementary School, Mill Creek Middle School, and Mill Valley High School.
Ownership History
Date
Name
Owned For
Owner Type
Purchase Details
Closed on
Jul 5, 2017
Sold by
Waldron Joseph A and Waldron Melinda M
Bought by
Dill Eric and Dill Jessica
Current Estimated Value
Home Financials for this Owner
Home Financials are based on the most recent Mortgage that was taken out on this home.
Original Mortgage
$277,000
Outstanding Balance
$188,223
Interest Rate
3.94%
Mortgage Type
New Conventional
Estimated Equity
$354,480
Purchase Details
Closed on
Sep 27, 2005
Sold by
Chapman Ronald D and Chapman Patricia L
Bought by
Waldron Joseph A and Waldron Melinda M
Home Financials for this Owner
Home Financials are based on the most recent Mortgage that was taken out on this home.
Original Mortgage
$247,500
Interest Rate
7.2%
Mortgage Type
Adjustable Rate Mortgage/ARM
Purchase Details
Closed on
Aug 6, 2002
Sold by
Duggan Homes Inc
Bought by
Chapman Ronald D and Chapman Patricia L
Create a Home Valuation Report for This Property
The Home Valuation Report is an in-depth analysis detailing your home's value as well as a comparison with similar homes in the area
Home Values in the Area
Average Home Value in this Area
Purchase History
| Date | Buyer | Sale Price | Title Company |
|---|---|---|---|
| Dill Eric | -- | First United Title Agency | |
| Waldron Joseph A | -- | Chicago Title Ins Co | |
| Chapman Ronald D | -- | Security Land Title Company |
Source: Public Records
Mortgage History
| Date | Status | Borrower | Loan Amount |
|---|---|---|---|
| Open | Dill Eric | $277,000 | |
| Previous Owner | Waldron Joseph A | $247,500 |
Source: Public Records
Tax History Compared to Growth
Tax History
| Year | Tax Paid | Tax Assessment Tax Assessment Total Assessment is a certain percentage of the fair market value that is determined by local assessors to be the total taxable value of land and additions on the property. | Land | Improvement |
|---|---|---|---|---|
| 2024 | $6,376 | $54,717 | $12,089 | $42,628 |
| 2023 | $6,185 | $52,578 | $12,089 | $40,489 |
| 2022 | $5,420 | $45,149 | $10,512 | $34,637 |
| 2021 | $5,270 | $42,228 | $9,554 | $32,674 |
| 2020 | $5,042 | $40,031 | $9,554 | $30,477 |
| 2019 | $4,790 | $37,467 | $7,391 | $30,076 |
| 2018 | $4,850 | $37,605 | $7,391 | $30,214 |
| 2017 | $4,790 | $36,236 | $7,391 | $28,845 |
| 2016 | $6,216 | $34,822 | $7,391 | $27,431 |
| 2015 | $4,556 | $33,430 | $7,391 | $26,039 |
| 2013 | -- | $30,245 | $7,391 | $22,854 |
Source: Public Records
Map
Nearby Homes
- 22611 W 46th Terrace
- 4638 Aminda St
- 22912 W 47th Terrace
- 4420 Anderson St
- 22714 W 49th St
- 9307 Aminda St
- 9303 Aminda St
- 9313 Aminda St
- 9305 Aminda St
- 22625 W 49th St
- 4403 Silverheel St
- 22014 W 47th Terrace
- 22910 W 51st St
- 5005 Hilltop Dr
- 4707 Noreston St
- 22014 W 51st St
- 5116 Payne St
- 22115 W 51st Terrace
- 4713 Lone Elm
- 5221 Meadow View Dr
- 22619 W 46th Terrace
- 22623 W 46th Terrace
- 22610 W 46th Terrace
- 4629 Anderson St
- 4633 Anderson St
- 22627 W 46th Terrace
- 22618 W 46th Terrace
- 22701 W 46th Terrace
- 4630 Anderson St
- 4626 Anderson St
- 4622 Anderson St
- 4611 Anderson St
- 4618 Anderson St
- 4614 Anderson St
- 22705 W 47th St
- 4610 Anderson St
- 22705 W 46th Terrace
- 4607 Anderson St
- 22708 W 46th Terrace
- 4606 Anderson St