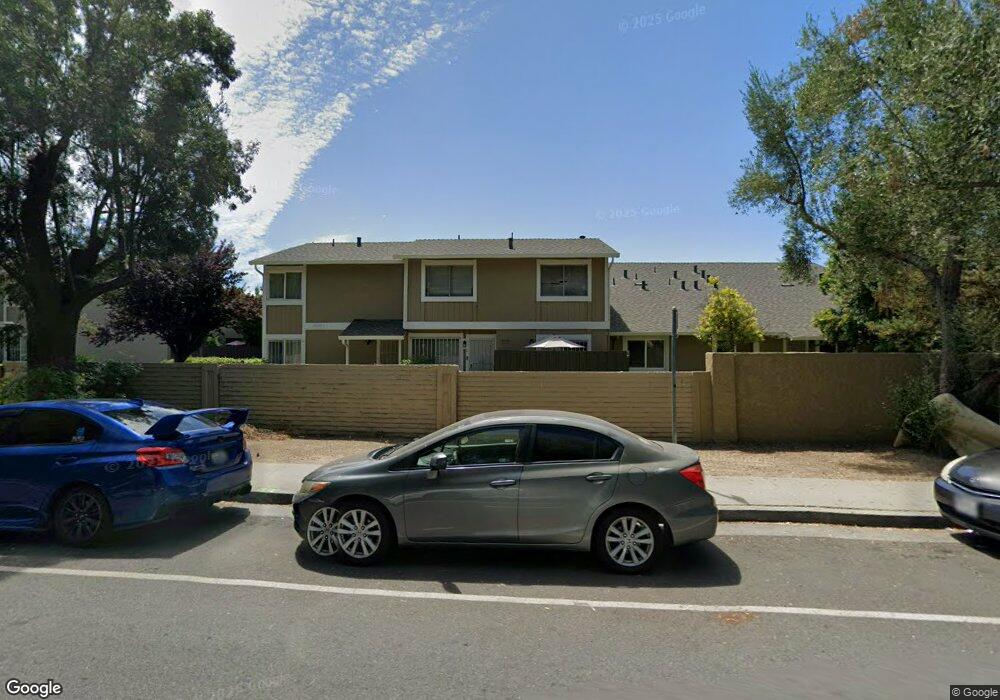
2262 Warfield Way Unit D San Jose, CA 95122
Yerba Buena NeighborhoodEstimated Value: $640,000 - $755,000
3
Beds
2
Baths
1,125
Sq Ft
$613/Sq Ft
Est. Value
About This Home
This home is located at 2262 Warfield Way Unit D, San Jose, CA 95122 and is currently estimated at $689,854, approximately $613 per square foot. 2262 Warfield Way Unit D is a home located in Santa Clara County with nearby schools including Stonegate Elementary School, Sylvandale Middle School, and Yerba Buena High School.
Ownership History
Date
Name
Owned For
Owner Type
Purchase Details
Closed on
Jun 24, 2003
Sold by
Modi Hasmukh
Bought by
Modi Hasmukh and Modi Rashmi
Current Estimated Value
Home Financials for this Owner
Home Financials are based on the most recent Mortgage that was taken out on this home.
Original Mortgage
$180,000
Outstanding Balance
$76,499
Interest Rate
5.37%
Mortgage Type
Purchase Money Mortgage
Estimated Equity
$613,355
Purchase Details
Closed on
Jan 20, 1994
Sold by
Gandhi Mahesh
Bought by
Modi Hasmukh
Home Financials for this Owner
Home Financials are based on the most recent Mortgage that was taken out on this home.
Original Mortgage
$60,350
Interest Rate
7.16%
Mortgage Type
FHA
Purchase Details
Closed on
Jan 13, 1994
Sold by
Modi Rashmi Hasmukh
Bought by
Modi Hasmukh
Home Financials for this Owner
Home Financials are based on the most recent Mortgage that was taken out on this home.
Original Mortgage
$60,350
Interest Rate
7.16%
Mortgage Type
FHA
Create a Home Valuation Report for This Property
The Home Valuation Report is an in-depth analysis detailing your home's value as well as a comparison with similar homes in the area
Home Values in the Area
Average Home Value in this Area
Purchase History
| Date | Buyer | Sale Price | Title Company |
|---|---|---|---|
| Modi Hasmukh | -- | Commonwealth Land Title | |
| Modi Hasmukh | -- | First American Title Guarant | |
| Modi Hasmukh | -- | First American Title Guarant |
Source: Public Records
Mortgage History
| Date | Status | Borrower | Loan Amount |
|---|---|---|---|
| Open | Modi Hasmukh | $180,000 | |
| Closed | Modi Hasmukh | $60,350 |
Source: Public Records
Tax History Compared to Growth
Tax History
| Year | Tax Paid | Tax Assessment Tax Assessment Total Assessment is a certain percentage of the fair market value that is determined by local assessors to be the total taxable value of land and additions on the property. | Land | Improvement |
|---|---|---|---|---|
| 2025 | $3,631 | $187,724 | $67,181 | $120,543 |
| 2024 | $3,631 | $184,044 | $65,864 | $118,180 |
| 2023 | $3,557 | $180,436 | $64,573 | $115,863 |
| 2022 | $3,484 | $176,899 | $63,307 | $113,592 |
| 2021 | $3,420 | $173,431 | $62,066 | $111,365 |
| 2020 | $3,224 | $171,654 | $61,430 | $110,224 |
| 2019 | $3,085 | $168,289 | $60,226 | $108,063 |
| 2018 | $3,061 | $164,991 | $59,046 | $105,945 |
| 2017 | $3,014 | $161,757 | $57,889 | $103,868 |
| 2016 | $2,865 | $158,586 | $56,754 | $101,832 |
| 2015 | $2,808 | $156,205 | $55,902 | $100,303 |
| 2014 | $2,336 | $153,146 | $54,807 | $98,339 |
Source: Public Records
Map
Nearby Homes
- 2102 Galveston Ave Unit A
- 2102 Galveston Ave Unit B
- 1058 Tekman Dr Unit 58
- 2416 Balme Dr
- 2175 Summerton Dr
- 988 Summerplace Dr
- 1042 Summermist Ct Unit 107
- 1050 Summermist Ct
- 1034 Summerplace Dr
- 1117 Indian Summer Ct
- 1087 Summerain Ct
- 2566 Boren Dr
- 2015 Tahiti Ct
- 1231 Turtlerock Dr
- 2706 Kendrick Cir
- 2580 Senter Rd Unit 455
- 2580 Senter Rd Unit 515
- 1381 Taper Ct
- 2570 Senter Rd
- 1887 Aberdeen Ct
- 2262 Warfield Way Unit C
- 2262 Warfield Way Unit B
- 2262 Warfield Way Unit A
- 2238 Warfield Way Unit B
- 2238 Warfield Way Unit D
- 2238 Warfield Way Unit C
- 2238 Warfield Way Unit B
- 2238 Warfield Way Unit A
- 2268 Warfield Way Unit C
- 2268 Warfield Way Unit B
- 2268 Warfield Way Unit A
- 2268 Warfield Way Unit D
- 2256 Warfield Way Unit D
- 2256 Warfield Way Unit C
- 2256 Warfield Way Unit B
- 2256 Warfield Way Unit A
- 2232 Warfield Way Unit D
- 2232 Warfield Way Unit C
- 2232 Warfield Way Unit B
- 2232 Warfield Way Unit A