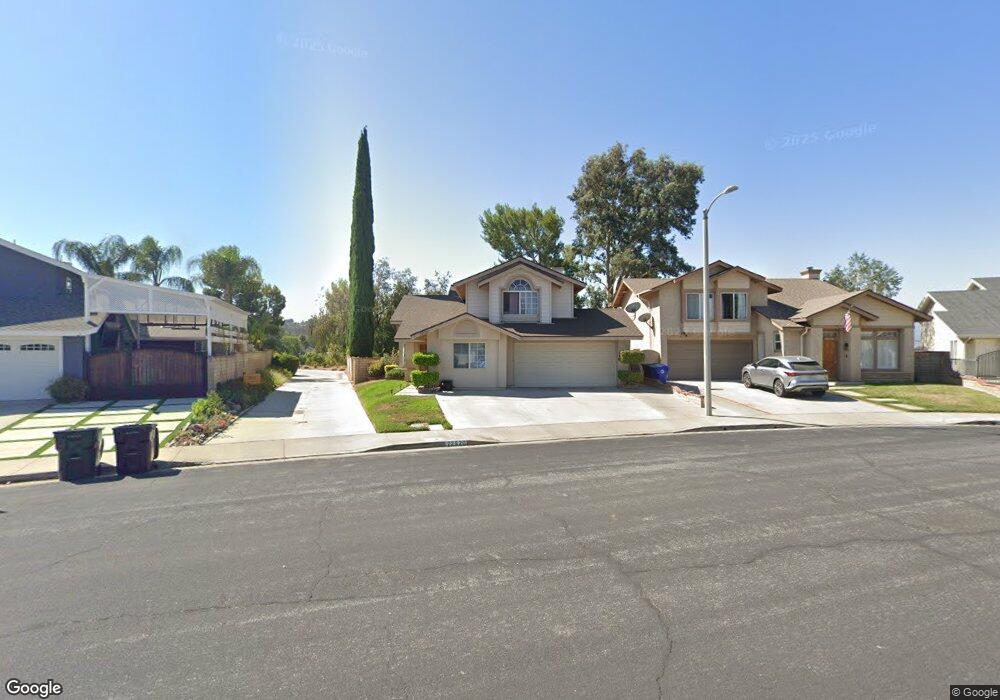
22620 Sarkis Ct Santa Clarita, CA 91350
Saugus NeighborhoodEstimated Value: $832,000 - $871,000
3
Beds
3
Baths
1,881
Sq Ft
$453/Sq Ft
Est. Value
About This Home
This home is located at 22620 Sarkis Ct, Santa Clarita, CA 91350 and is currently estimated at $851,793, approximately $452 per square foot. 22620 Sarkis Ct is a home located in Los Angeles County with nearby schools including James Foster Elementary School, Arroyo Seco Junior High School, and Saugus High School.
Ownership History
Date
Name
Owned For
Owner Type
Purchase Details
Closed on
Nov 7, 2000
Sold by
Sagardia John R and Sagardia Kimberly A
Bought by
Sanchez Jesse R and Sanchez Marisol
Current Estimated Value
Home Financials for this Owner
Home Financials are based on the most recent Mortgage that was taken out on this home.
Original Mortgage
$249,750
Outstanding Balance
$90,648
Interest Rate
7.67%
Estimated Equity
$761,145
Purchase Details
Closed on
Jun 29, 1995
Sold by
Emc Mtg Corp
Bought by
Sagardia John R and Sagardia Kimberly A
Home Financials for this Owner
Home Financials are based on the most recent Mortgage that was taken out on this home.
Original Mortgage
$170,525
Interest Rate
7.62%
Purchase Details
Closed on
Apr 3, 1995
Sold by
Great Western Bank Fsb
Bought by
Emc Mtg Corp
Purchase Details
Closed on
Mar 3, 1995
Sold by
Aker Omer M and Great Western Bank Fsb
Bought by
Great Western Bank Fsb
Create a Home Valuation Report for This Property
The Home Valuation Report is an in-depth analysis detailing your home's value as well as a comparison with similar homes in the area
Home Values in the Area
Average Home Value in this Area
Purchase History
| Date | Buyer | Sale Price | Title Company |
|---|---|---|---|
| Sanchez Jesse R | $257,500 | Southland Title | |
| Sagardia John R | $179,500 | Chicago Title Co | |
| Emc Mtg Corp | $148,000 | Chicago Title Insurance Co | |
| Great Western Bank Fsb | $160,551 | Chicago Title Company |
Source: Public Records
Mortgage History
| Date | Status | Borrower | Loan Amount |
|---|---|---|---|
| Open | Sanchez Jesse R | $249,750 | |
| Previous Owner | Sagardia John R | $170,525 |
Source: Public Records
Tax History Compared to Growth
Tax History
| Year | Tax Paid | Tax Assessment Tax Assessment Total Assessment is a certain percentage of the fair market value that is determined by local assessors to be the total taxable value of land and additions on the property. | Land | Improvement |
|---|---|---|---|---|
| 2025 | $5,832 | $408,129 | $223,150 | $184,979 |
| 2024 | $5,832 | $400,127 | $218,775 | $181,352 |
| 2023 | $5,718 | $392,283 | $214,486 | $177,797 |
| 2022 | $5,689 | $384,592 | $210,281 | $174,311 |
| 2021 | $5,591 | $377,052 | $206,158 | $170,894 |
| 2019 | $5,394 | $365,871 | $200,045 | $165,826 |
| 2018 | $5,229 | $358,698 | $196,123 | $162,575 |
| 2016 | $5,265 | $344,771 | $188,508 | $156,263 |
| 2015 | $5,083 | $339,593 | $185,677 | $153,916 |
| 2014 | $5,014 | $332,941 | $182,040 | $150,901 |
Source: Public Records
Map
Nearby Homes
- 27573 Santa Clarita Rd
- 27929 Dexter Dr
- 27829 Carnegie Ave
- 22654 La Rochelle Dr
- 27439 Santa Clarita Rd
- 22660 La Rochelle Dr
- 27872 Cherry Creek Dr
- 22617 Copper Hill Dr Unit 121
- 27362 Santa Clarita Rd
- 28114 Seco Canyon Rd Unit 156
- 22713 Copper Hill Dr Unit 42
- 22403 Los Rogues Dr
- 27717 Sequoia Glen Dr
- 28121 Seco Canyon Rd Unit 86
- 28123 Seco Canyon Rd Unit 94
- 28241 Tamarack Ln
- 28321 Evergreen Ln
- 28015 Tupelo Ridge Dr
- 22035 Conway Place
- 22839 Banyan Place Unit 334
- 22622 Sarkis Ct
- 22614 Sarkis Ct
- 22626 Sarkis Ct
- 22616 Sarkis Ct
- 22606 Sarkis Ct
- 22625 Sarkis Ct
- 22615 Sarkis Ct
- 22623 Sarkis Ct
- 22602 Sarkis Ct
- 22621 Sarkis Ct
- 27655 Spandau Dr
- 22607 Sarkis Ct
- 22643 Calvello Dr
- 22603 Sarkis Ct
- 22643 Dr Calvello Dr
- 27637 Spandau Dr
- 22655 Calvello Dr
- 22637 Calvello Dr
- 27717 Spandau Dr
- 27715 Spandau Dr