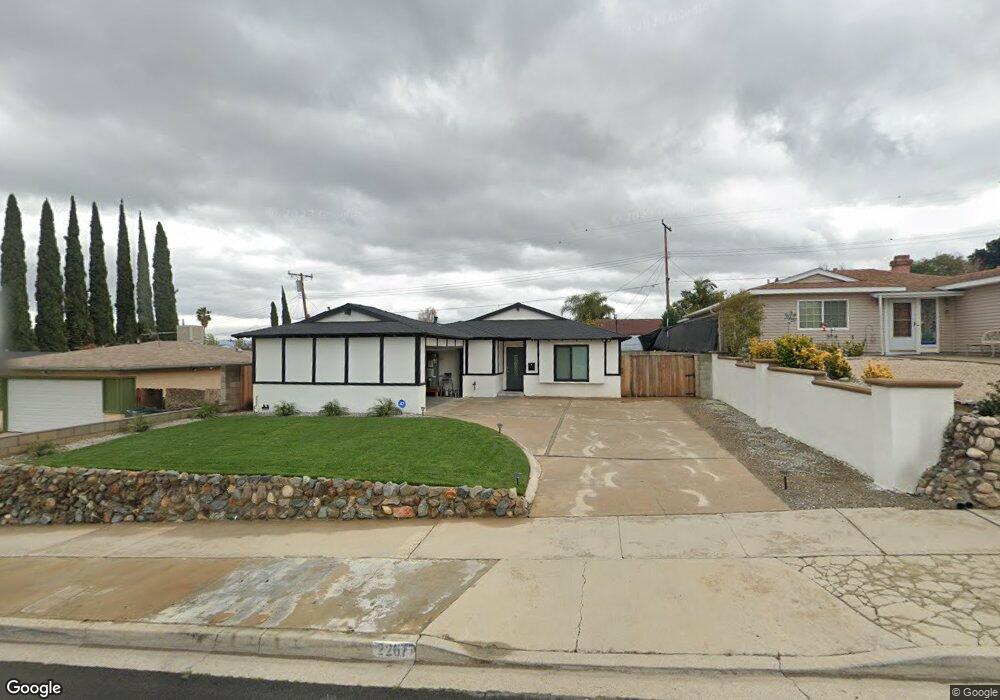
2267 Avenida Del Vista Corona, CA 92882
Central Corona NeighborhoodEstimated Value: $700,000 - $737,972
3
Beds
2
Baths
1,095
Sq Ft
$656/Sq Ft
Est. Value
About This Home
This home is located at 2267 Avenida Del Vista, Corona, CA 92882 and is currently estimated at $718,493, approximately $656 per square foot. 2267 Avenida Del Vista is a home located in Riverside County with nearby schools including John Adams Elementary School, Letha Raney Intermediate School, and Corona High School.
Ownership History
Date
Name
Owned For
Owner Type
Purchase Details
Closed on
Jun 3, 2022
Sold by
B & J Real Estate Investments Inc
Bought by
Ekwenuke Victoria
Current Estimated Value
Home Financials for this Owner
Home Financials are based on the most recent Mortgage that was taken out on this home.
Original Mortgage
$647,200
Outstanding Balance
$614,894
Interest Rate
5.1%
Mortgage Type
New Conventional
Estimated Equity
$103,599
Purchase Details
Closed on
Aug 15, 2014
Sold by
Forney Sandra J
Bought by
Robles Salvador and Aranda Laurie
Home Financials for this Owner
Home Financials are based on the most recent Mortgage that was taken out on this home.
Original Mortgage
$299,475
Interest Rate
4.4%
Mortgage Type
FHA
Purchase Details
Closed on
Sep 17, 2008
Sold by
Salinas Pedro B
Bought by
Forney Sandra J and Sandray J Forney Living Trust
Purchase Details
Closed on
May 3, 2001
Sold by
Forney Sandra J
Bought by
Forney Sandra J and Sandra J Forney Living Trust
Create a Home Valuation Report for This Property
The Home Valuation Report is an in-depth analysis detailing your home's value as well as a comparison with similar homes in the area
Home Values in the Area
Average Home Value in this Area
Purchase History
| Date | Buyer | Sale Price | Title Company |
|---|---|---|---|
| Ekwenuke Victoria | $705,000 | None Listed On Document | |
| Robles Salvador | $305,000 | Nextitle | |
| Forney Sandra J | -- | None Available | |
| Forney Sandra J | -- | -- |
Source: Public Records
Mortgage History
| Date | Status | Borrower | Loan Amount |
|---|---|---|---|
| Open | Ekwenuke Victoria | $647,200 | |
| Previous Owner | Robles Salvador | $299,475 |
Source: Public Records
Tax History Compared to Growth
Tax History
| Year | Tax Paid | Tax Assessment Tax Assessment Total Assessment is a certain percentage of the fair market value that is determined by local assessors to be the total taxable value of land and additions on the property. | Land | Improvement |
|---|---|---|---|---|
| 2025 | $8,201 | $748,150 | $186,772 | $561,378 |
| 2023 | $8,201 | $719,100 | $179,520 | $539,580 |
| 2022 | $3,923 | $345,413 | $101,923 | $243,490 |
| 2021 | $3,846 | $338,641 | $99,925 | $238,716 |
| 2020 | $3,804 | $335,170 | $98,901 | $236,269 |
| 2019 | $3,716 | $328,599 | $96,962 | $231,637 |
| 2018 | $3,633 | $322,157 | $95,062 | $227,095 |
| 2017 | $3,545 | $315,842 | $93,199 | $222,643 |
| 2016 | $3,511 | $309,650 | $91,372 | $218,278 |
| 2015 | $3,435 | $305,000 | $90,000 | $215,000 |
| 2014 | $2,052 | $183,223 | $76,881 | $106,342 |
Source: Public Records
Map
Nearby Homes
- 2314 Mcneil Cir
- 1925 Adobe Ave
- 1486 Baird St
- 1757 Fraser Cir
- 1427 Baird St
- 1344 Brentwood Cir Unit C
- 1554 Border Ave Unit G
- 1598 Border Ave Unit H
- 2393 Mesquite Ln
- 1310 Brentwood Cir Unit B
- 1763 Gleason St
- 2548 Avenida Del Vista Unit 103
- 1720 Sugar Pine Dr
- 1535 Border Ave Unit C
- 2350 Centennial Way
- 1365 Kroonen Dr
- 1871 Dawn Ridge Dr
- 2568 Avenida Del Vista Unit 201
- 2568 Avenida Del Vista Unit 203
- 1167 Hummingbird Ln
- 2267 Avenida Del Vista
- 2255 Avenida Del Vista
- 2271 Avenida Del Vista
- 2256 Longview Dr
- 2245 Avenida Del Vista
- 2268 Longview Dr
- 2275 Avenida Del Vista
- 2246 Longview Dr
- 2272 Longview Dr
- 2264 Avenida Del Vista
- 2264 Avenida Del Vista
- 2239 Avenida Del Vista
- 2250 Avenida Del Vista
- 2281 Avenida Del Vista
- 2270 Avenida Del Vista
- 2250 Avenida Del Vista
- 2280 Longview Dr
- 2240 Longview Dr
- 2274 Avenida Del Vista
- 2242 Avenida Del Vista