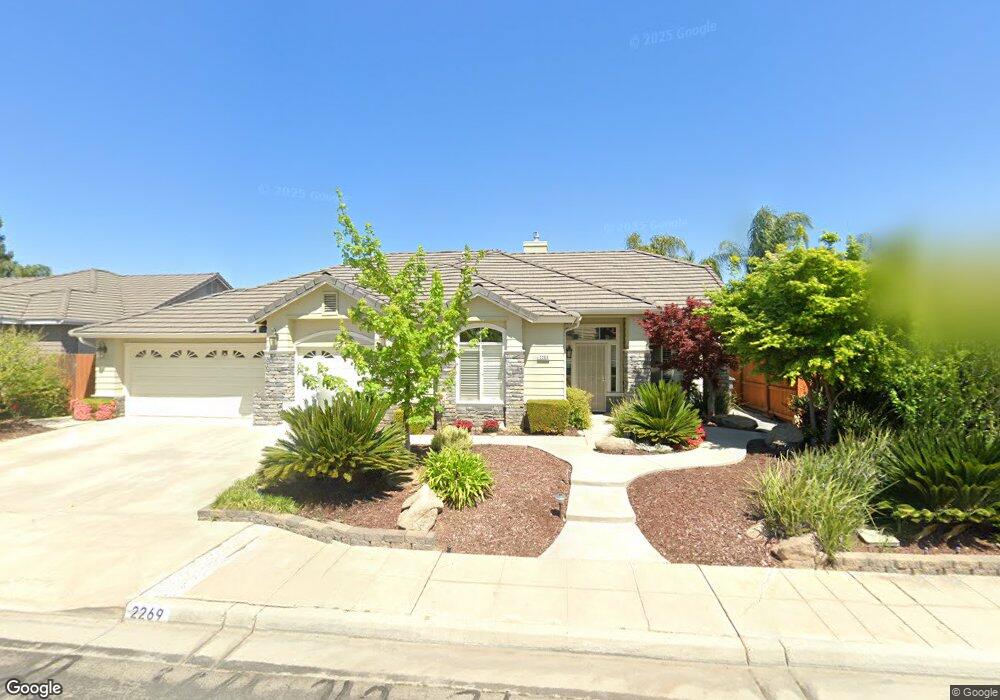
2269 Houston Ave Clovis, CA 93611
Estimated Value: $501,000 - $542,000
3
Beds
2
Baths
1,610
Sq Ft
$320/Sq Ft
Est. Value
About This Home
This home is located at 2269 Houston Ave, Clovis, CA 93611 and is currently estimated at $515,888, approximately $320 per square foot. 2269 Houston Ave is a home located in Fresno County with nearby schools including Dry Creek Elementary School, Alta Sierra Intermediate School, and Buchanan High School.
Ownership History
Date
Name
Owned For
Owner Type
Purchase Details
Closed on
Jul 8, 2015
Sold by
Rodgers Michael and Rodgers Melinda Kay
Bought by
2015 Rodgers Family Revocable Trust and Rodgers Melinda Kay
Current Estimated Value
Purchase Details
Closed on
Oct 16, 2001
Sold by
Sandusky Karren J and Roberts Melissa J
Bought by
Rodgers Michael and Rodgers Melinda
Home Financials for this Owner
Home Financials are based on the most recent Mortgage that was taken out on this home.
Original Mortgage
$143,996
Outstanding Balance
$55,294
Interest Rate
6.63%
Estimated Equity
$460,594
Purchase Details
Closed on
Apr 5, 1999
Sold by
Sandusky William J and Sandusky Donne L
Bought by
Sandusky Karren J
Purchase Details
Closed on
Jan 22, 1997
Sold by
Sandusky Karren J
Bought by
Sandusky Karren J and Roberts Melissa J
Purchase Details
Closed on
Dec 6, 1995
Sold by
Sandusky Karren
Bought by
Sandusky William J and Sandusky Donne L
Purchase Details
Closed on
Apr 5, 1994
Sold by
Centex Real Estate Corp
Bought by
Sandusky Karren J
Home Financials for this Owner
Home Financials are based on the most recent Mortgage that was taken out on this home.
Original Mortgage
$132,260
Interest Rate
8.52%
Mortgage Type
FHA
Create a Home Valuation Report for This Property
The Home Valuation Report is an in-depth analysis detailing your home's value as well as a comparison with similar homes in the area
Home Values in the Area
Average Home Value in this Area
Purchase History
| Date | Buyer | Sale Price | Title Company |
|---|---|---|---|
| 2015 Rodgers Family Revocable Trust | -- | None Available | |
| Rodgers Michael | -- | None Available | |
| Rodgers Michael | $180,000 | Chicago Title Co | |
| Sandusky Karren J | -- | Chicago Title Co | |
| Sandusky Karren J | -- | -- | |
| Sandusky William J | -- | Stewart Title | |
| Sandusky Karren J | $135,500 | Chicago Title Company |
Source: Public Records
Mortgage History
| Date | Status | Borrower | Loan Amount |
|---|---|---|---|
| Open | Rodgers Michael | $143,996 | |
| Previous Owner | Sandusky Karren J | $132,260 |
Source: Public Records
Tax History
| Year | Tax Paid | Tax Assessment Tax Assessment Total Assessment is a certain percentage of the fair market value that is determined by local assessors to be the total taxable value of land and additions on the property. | Land | Improvement |
|---|---|---|---|---|
| 2025 | $3,219 | $265,152 | $78,285 | $186,867 |
| 2023 | $3,085 | $254,857 | $75,246 | $179,611 |
| 2022 | $3,045 | $249,861 | $73,771 | $176,090 |
| 2021 | $2,941 | $244,963 | $72,325 | $172,638 |
| 2020 | $2,930 | $242,452 | $71,584 | $170,868 |
| 2019 | $2,874 | $237,699 | $70,181 | $167,518 |
| 2018 | $2,812 | $233,039 | $68,805 | $164,234 |
| 2017 | $2,765 | $228,470 | $67,456 | $161,014 |
| 2016 | $2,674 | $223,991 | $66,134 | $157,857 |
| 2015 | $2,621 | $220,627 | $65,141 | $155,486 |
| 2014 | $2,573 | $216,306 | $63,865 | $152,441 |
Source: Public Records
Map
Nearby Homes
- 2117 Goshen Ave
- 971 N Filbert Ave
- 2361 Cromwell Ave
- 1977 Goshen Ave
- 878 N Ash Ave
- 2670 Muncie Ave
- 8220 N Fowler Ave
- 2643 Quincy Ave
- 1754 Decatur Ave
- 2770 Muncie Ave
- 1731 N Hanson Ave
- 1734 N Park Ave
- 2319 Prescott Ave
- 367 N Raphael Ln Unit 367
- 1 Ave
- 2936 Trenton Ave
- 338 N Filbert Ave
- 3091 Teague Ave
- 2966 Trenton Ave
- 1617 N Megan Ave
- 2279 Houston Ave
- 2259 Houston Ave
- 2252 Jordan Ave
- 2262 Jordan Ave
- 2242 Jordan Ave
- 2299 Houston Ave
- 2260 Houston Ave
- 2249 Houston Ave
- 2270 Houston Ave
- 2250 Houston Ave
- 2232 Jordan Ave
- 1155 N Jasmine Ave
- 2290 Houston Ave
- 2309 Houston Ave
- 1142 N Filbert Ave
- 2222 Jordan Ave
- 1132 N Filbert Ave
- 1175 N Jasmine Ave
- 2267 Goshen Ave
- 2251 Jordan Ave
Your Personal Tour Guide
Ask me questions while you tour the home.