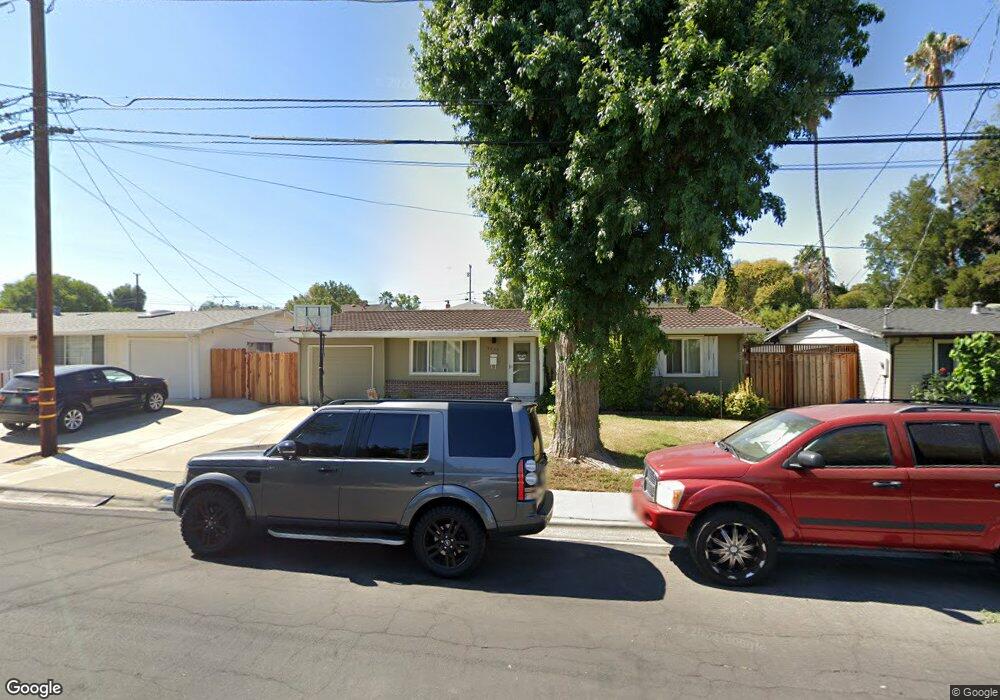
2272 Krueger Dr Concord, CA 94520
Glenbrook Heights NeighborhoodEstimated Value: $585,000 - $665,000
3
Beds
2
Baths
1,161
Sq Ft
$534/Sq Ft
Est. Value
About This Home
This home is located at 2272 Krueger Dr, Concord, CA 94520 and is currently estimated at $620,219, approximately $534 per square foot. 2272 Krueger Dr is a home located in Contra Costa County with nearby schools including Sun Terrace Elementary School, El Dorado Middle School, and Mt. Diablo High School.
Ownership History
Date
Name
Owned For
Owner Type
Purchase Details
Closed on
Sep 18, 2020
Sold by
Maxson Steven D
Bought by
Maxson Steven D and Bald Laura T
Current Estimated Value
Home Financials for this Owner
Home Financials are based on the most recent Mortgage that was taken out on this home.
Original Mortgage
$250,000
Outstanding Balance
$213,001
Interest Rate
2.9%
Mortgage Type
Credit Line Revolving
Estimated Equity
$407,218
Purchase Details
Closed on
Feb 25, 2015
Sold by
Kemp Randall B
Bought by
Maxson Steven D
Purchase Details
Closed on
Apr 3, 2014
Sold by
Kemp Marsha Jean
Bought by
Kemp Randall B and Kemp Marsha Jean
Purchase Details
Closed on
Nov 6, 2013
Sold by
Kemp Marsha Jean and Kuchinski John G
Bought by
Kemp Marsha Jean
Purchase Details
Closed on
Jun 8, 2012
Sold by
Kuchinski Marie Pauline
Bought by
Kuchinski Marie Pauline and Kemp Marsha Jean
Purchase Details
Closed on
Jun 11, 1997
Sold by
Kuchinski John P and Kuchinski Marie P
Bought by
Kuchinski John Gerald and Kuchinski Marie Pauline
Create a Home Valuation Report for This Property
The Home Valuation Report is an in-depth analysis detailing your home's value as well as a comparison with similar homes in the area
Home Values in the Area
Average Home Value in this Area
Purchase History
| Date | Buyer | Sale Price | Title Company |
|---|---|---|---|
| Maxson Steven D | -- | Placer Title Company | |
| Maxson Steven D | -- | None Available | |
| Kemp Randall B | -- | None Available | |
| Kemp Marsha Jean | -- | None Available | |
| Kuchinski Marie Pauline | -- | None Available | |
| Kuchinski John Gerald | -- | -- |
Source: Public Records
Mortgage History
| Date | Status | Borrower | Loan Amount |
|---|---|---|---|
| Open | Maxson Steven D | $250,000 |
Source: Public Records
Tax History
| Year | Tax Paid | Tax Assessment Tax Assessment Total Assessment is a certain percentage of the fair market value that is determined by local assessors to be the total taxable value of land and additions on the property. | Land | Improvement |
|---|---|---|---|---|
| 2025 | $1,674 | $65,974 | $25,023 | $40,951 |
| 2024 | $1,553 | $64,682 | $24,533 | $40,149 |
| 2023 | $1,553 | $63,414 | $24,052 | $39,362 |
| 2022 | $1,504 | $62,172 | $23,581 | $38,591 |
| 2021 | $1,445 | $60,954 | $23,119 | $37,835 |
| 2019 | $1,399 | $59,148 | $22,434 | $36,714 |
| 2018 | $1,330 | $57,990 | $21,995 | $35,995 |
| 2017 | $1,266 | $56,854 | $21,564 | $35,290 |
| 2016 | $1,263 | $55,741 | $21,142 | $34,599 |
| 2015 | $1,144 | $54,905 | $20,825 | $34,080 |
| 2014 | $1,088 | $53,831 | $20,418 | $33,413 |
Source: Public Records
Map
Nearby Homes
- 2219 Acacia Dr
- 2917 Knoll Dr
- 2102 Overhill Rd
- 3242 Ida Dr
- 3185 Claudia Dr
- 2780 Argyll Ave
- 2766 Argyll Ave
- 2653 Garden Ave
- 3485 Hillsborough Dr
- 3179 Meadowbrook Dr
- 2819 Kay Ave
- 2719 Grant St
- 2719 Edward Ave
- 2868 Avon Ave
- 2097 Dalis Dr Unit 79
- 2069 Olivera Rd Unit E
- 2227 Dalis Dr Unit 159
- 2067 Olivera Rd Unit B
- 2831 Richard Ave
- 2197 Dalis Dr Unit 124
- 2284 Krueger Dr
- 2246 Krueger Dr
- 2261 Acacia Dr
- 2273 Acacia Dr
- 2232 Krueger Dr
- 3001 Ash St
- 2245 Krueger Dr
- 2285 Acacia Dr
- 2247 Acacia Dr
- 2273 Krueger Dr
- 2297 Acacia Dr
- 2233 Acacia Dr
- 2218 Krueger Dr
- 2285 Krueger Dr
- 3012 Tosca Way
- 2219 Krueger Dr
- 3019 Bertram Ct
- 2297 Krueger Dr
- 2300 Krueger Dr
- 2210 Krueger Dr
Your Personal Tour Guide
Ask me questions while you tour the home.