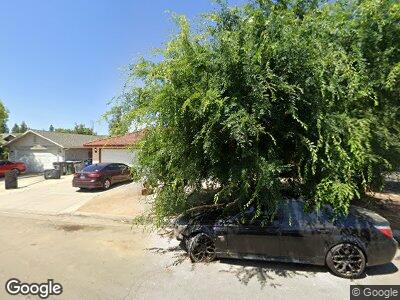
2273 N Rafael Ave Fresno, CA 93722
West Fresno NeighborhoodEstimated Value: $311,000 - $445,000
4
Beds
2
Baths
1,683
Sq Ft
$222/Sq Ft
Est. Value
About This Home
This home is located at 2273 N Rafael Ave, Fresno, CA 93722 and is currently estimated at $374,263, approximately $222 per square foot. 2273 N Rafael Ave is a home located in Fresno County with nearby schools including Hanh Phan Tilley Elementary, El Capitan Middle School, and Central East High School.
Ownership History
Date
Name
Owned For
Owner Type
Purchase Details
Closed on
Jun 2, 2021
Sold by
Henry Delfino Martinez Revocable Trus and Martinez Henry M
Bought by
Martinez Nicolette
Current Estimated Value
Home Financials for this Owner
Home Financials are based on the most recent Mortgage that was taken out on this home.
Interest Rate
2.95%
Purchase Details
Closed on
May 19, 2021
Sold by
Martinez Henry M and The Henry Delfino Mertinez Rev
Bought by
Martinez Nicolette
Home Financials for this Owner
Home Financials are based on the most recent Mortgage that was taken out on this home.
Interest Rate
2.95%
Purchase Details
Closed on
Aug 29, 2016
Sold by
Martinez Henry Delfino
Bought by
Martinez Henry Delfino and Henry Delfino Martinez Revocable Trust
Purchase Details
Closed on
Mar 17, 2000
Sold by
Martinez Henry D and Martinez Pauline F
Bought by
Martinez Henry D and Martinez Pauline F
Create a Home Valuation Report for This Property
The Home Valuation Report is an in-depth analysis detailing your home's value as well as a comparison with similar homes in the area
Home Values in the Area
Average Home Value in this Area
Purchase History
| Date | Buyer | Sale Price | Title Company |
|---|---|---|---|
| Martinez Nicolette | -- | -- | |
| Henry Delfino Martinez Revocable Trust | -- | -- | |
| Martinez Nicolette | -- | None Available | |
| Henry Delfino Martinez Revocable Trust | -- | -- | |
| Martinez Henry Delfino | -- | None Available | |
| Martinez Henry D | -- | -- | |
| Martinez Henry D | -- | -- |
Source: Public Records
Mortgage History
| Date | Status | Borrower | Loan Amount |
|---|---|---|---|
| Closed | Martinez Nicolette | -- | |
| Previous Owner | Martinez Henry D | $0 |
Source: Public Records
Tax History Compared to Growth
Tax History
| Year | Tax Paid | Tax Assessment Tax Assessment Total Assessment is a certain percentage of the fair market value that is determined by local assessors to be the total taxable value of land and additions on the property. | Land | Improvement |
|---|---|---|---|---|
| 2023 | $3,879 | $301,716 | $52,020 | $249,696 |
| 2022 | $3,660 | $295,800 | $51,000 | $244,800 |
| 2021 | $2,178 | $169,589 | $40,828 | $128,761 |
| 2020 | $2,072 | $167,851 | $40,410 | $127,441 |
| 2019 | $2,041 | $164,561 | $39,618 | $124,943 |
| 2018 | $1,995 | $161,336 | $38,842 | $122,494 |
| 2017 | $2,002 | $158,174 | $38,081 | $120,093 |
| 2016 | $1,846 | $155,074 | $37,335 | $117,739 |
| 2015 | $1,839 | $152,746 | $36,775 | $115,971 |
| 2014 | $1,838 | $149,755 | $36,055 | $113,700 |
Source: Public Records
Map
Nearby Homes
- 3561 W Weldon Ave
- 2409 N Valentine Ave
- 3622 W Terrace Ave
- 3256 W Clinton Ave
- 2194 N Feland Ave
- 2287 N Vernal Ave
- 3154 W Mckinley Ave
- 3185 W Mckinley Ave
- 2736 N Selland Ave
- 2347 N Sonora Ave
- 2413 N Sonora Ave
- 3109 W Mckinley Ave Unit 29
- 2765 N Dewey Ave
- 3425 W Forrest Dr
- 1512 N Brawley Ave
- 3575 W Cortland Ave
- 4327 W Brown Ave
- 2272 N Mitre Ave
- 2533 W Mckinley Ave Unit 232
- 2533 W Mckinley Ave Unit 290
- 2273 N Rafael Ave
- 2263 N Rafael Ave
- 2255 N Rafael Ave
- 2291 N Rafael Ave
- 2264 N Selland Ave
- 2256 N Selland Ave
- 3476 W Cambridge Ave
- 3477 W Yale Ave
- 2280 N Selland Ave
- 2248 N Selland Ave
- 2245 N Rafael Ave
- 3466 W Cambridge Ave
- 2240 N Selland Ave
- 3467 W Yale Ave
- 2288 N Selland Ave
- 3475 W Cambridge Ave
- 2237 N Rafael Ave
- 3524 W Cambridge Ave
- 3456 W Cambridge Ave
- 2234 N Selland Ave