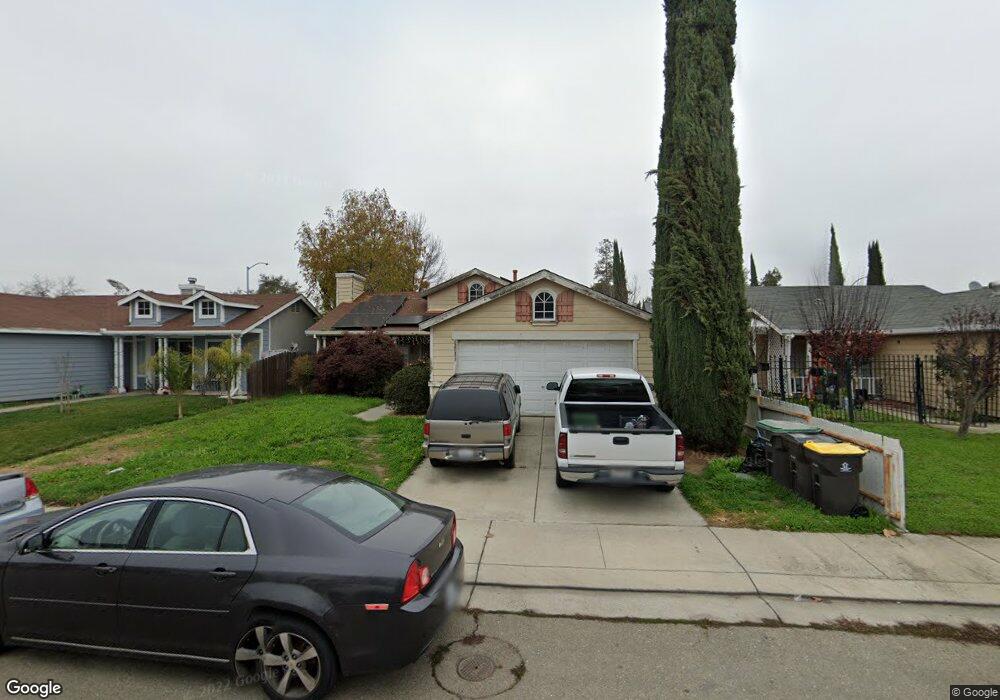
2273 Titleist Ct Stockton, CA 95206
Seaport NeighborhoodEstimated Value: $354,752 - $388,000
3
Beds
2
Baths
1,023
Sq Ft
$361/Sq Ft
Est. Value
About This Home
This home is located at 2273 Titleist Ct, Stockton, CA 95206 and is currently estimated at $369,688, approximately $361 per square foot. 2273 Titleist Ct is a home located in San Joaquin County with nearby schools including San Joaquin Elementary School, John Marshall Elementary School, and Taylor Leadership Academy.
Ownership History
Date
Name
Owned For
Owner Type
Purchase Details
Closed on
Jun 9, 2005
Sold by
Pacheco Martin H and Pacheco Constance D
Bought by
Pacheco Martin and Pacheco Constance
Current Estimated Value
Home Financials for this Owner
Home Financials are based on the most recent Mortgage that was taken out on this home.
Original Mortgage
$188,000
Outstanding Balance
$97,135
Interest Rate
5.6%
Mortgage Type
Purchase Money Mortgage
Estimated Equity
$272,553
Purchase Details
Closed on
Oct 22, 1999
Sold by
Kennon Tonya L
Bought by
Pacheco Martin H and Pacheco Constance D
Home Financials for this Owner
Home Financials are based on the most recent Mortgage that was taken out on this home.
Original Mortgage
$95,400
Interest Rate
9.99%
Purchase Details
Closed on
May 28, 1994
Sold by
Kaufman & Broad Central Valley Inc
Bought by
Kennon Tonya L
Home Financials for this Owner
Home Financials are based on the most recent Mortgage that was taken out on this home.
Original Mortgage
$93,098
Interest Rate
8.3%
Mortgage Type
FHA
Create a Home Valuation Report for This Property
The Home Valuation Report is an in-depth analysis detailing your home's value as well as a comparison with similar homes in the area
Home Values in the Area
Average Home Value in this Area
Purchase History
| Date | Buyer | Sale Price | Title Company |
|---|---|---|---|
| Pacheco Martin | -- | Alliance Title Co | |
| Pacheco Martin H | $106,000 | Old Republic Title Company | |
| Kennon Tonya L | $94,000 | -- |
Source: Public Records
Mortgage History
| Date | Status | Borrower | Loan Amount |
|---|---|---|---|
| Open | Pacheco Martin | $188,000 | |
| Closed | Pacheco Martin H | $95,400 | |
| Previous Owner | Kennon Tonya L | $93,098 | |
| Closed | Pacheco Martin H | $5,300 |
Source: Public Records
Tax History Compared to Growth
Tax History
| Year | Tax Paid | Tax Assessment Tax Assessment Total Assessment is a certain percentage of the fair market value that is determined by local assessors to be the total taxable value of land and additions on the property. | Land | Improvement |
|---|---|---|---|---|
| 2025 | $2,088 | $162,907 | $38,419 | $124,488 |
| 2024 | $2,053 | $159,714 | $37,666 | $122,048 |
| 2023 | $2,005 | $156,583 | $36,928 | $119,655 |
| 2022 | $1,877 | $153,513 | $36,204 | $117,309 |
| 2021 | $1,808 | $150,504 | $35,495 | $115,009 |
| 2020 | $5,714 | $148,962 | $35,132 | $113,830 |
| 2019 | $1,832 | $146,043 | $34,444 | $111,599 |
| 2018 | $2,481 | $143,180 | $33,769 | $109,411 |
| 2017 | $2,238 | $140,373 | $33,107 | $107,266 |
| 2016 | $2,236 | $137,621 | $32,458 | $105,163 |
| 2014 | $2,127 | $132,899 | $31,344 | $101,555 |
Source: Public Records
Map
Nearby Homes
- 2050 Grey Stone Dr
- 1823 Fort Hall Place
- 2128 Green River Ln
- 2650 S Fresno Ave
- 1409 Laguna Cir
- 1413 Laguna Cir
- 1232 Denver Ave
- 1156 Derrick Dr
- 2215 Dune Place
- 2402 Sailboat Ct
- 2428 Shell Ct
- 2242 Port Trinity Cir
- 2079 Gordon Verner Cir
- 2625 Crestmore Cir
- 3745 Wild Rose Ln
- 864 W 5th St
- 1890 Gordon Verner Cir
- 3779 Zeally Ln
- 1661 W Hazelton Ave
- 1526 Kimiyo St
- 2265 Titleist Ct
- 2307 Titleist Ct
- 2148 Tilden Park St
- 2257 Titleist Ct
- 2323 Titleist Ct
- 2249 Titleist Ct
- 2339 Titleist Ct
- 2266 Titleist Ct
- 2201 Tilden Park St
- 2260 Titleist Ct
- 2224 Saint Lakes Way
- 2355 Titleist Ct
- 2310 Blue Tees Dr
- 2252 Titleist Ct
- 2215 Tilden Park St
- 2216 Saint Lakes Way
- 2202 van Buskirk St
- 2322 Blue Tees Dr
- 2248 Titleist Ct
- 2233 Titleist Ct