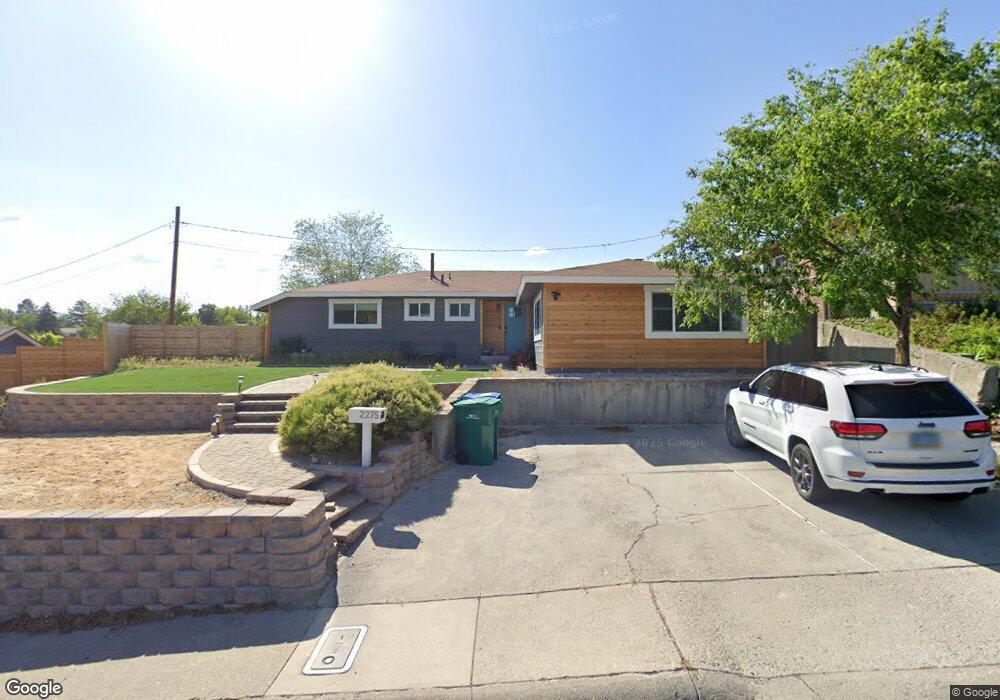
2275 Ellendale Rd Reno, NV 89503
Kings Row NeighborhoodEstimated Value: $428,000 - $479,000
3
Beds
2
Baths
1,210
Sq Ft
$382/Sq Ft
Est. Value
About This Home
This home is located at 2275 Ellendale Rd, Reno, NV 89503 and is currently estimated at $461,965, approximately $381 per square foot. 2275 Ellendale Rd is a home located in Washoe County with nearby schools including Peavine Elementary School, Archie Clayton Pre-AP Academy, and Reno High School.
Ownership History
Date
Name
Owned For
Owner Type
Purchase Details
Closed on
Oct 4, 2001
Sold by
Weaver Ronald R and Weaver Christine
Bought by
Weaver Jason J
Current Estimated Value
Home Financials for this Owner
Home Financials are based on the most recent Mortgage that was taken out on this home.
Original Mortgage
$131,000
Interest Rate
6.91%
Mortgage Type
Balloon
Purchase Details
Closed on
Nov 12, 1999
Sold by
Rich Henry James and Rich Caroline
Bought by
Weaver Jason J and Weaver Ronald J
Home Financials for this Owner
Home Financials are based on the most recent Mortgage that was taken out on this home.
Original Mortgage
$126,432
Interest Rate
7.82%
Mortgage Type
FHA
Purchase Details
Closed on
Nov 19, 1998
Sold by
Rich Laura Jane
Bought by
Rich Henry James
Purchase Details
Closed on
Nov 11, 1998
Sold by
Rich Laura Jane
Bought by
Rich Henry James
Create a Home Valuation Report for This Property
The Home Valuation Report is an in-depth analysis detailing your home's value as well as a comparison with similar homes in the area
Home Values in the Area
Average Home Value in this Area
Purchase History
| Date | Buyer | Sale Price | Title Company |
|---|---|---|---|
| Weaver Jason J | -- | First Centennial Title Co | |
| Weaver Jason J | $127,500 | First Centennial Title Co | |
| Rich Henry James | -- | -- | |
| Rich Henry James | -- | -- |
Source: Public Records
Mortgage History
| Date | Status | Borrower | Loan Amount |
|---|---|---|---|
| Closed | Weaver Jason J | $131,000 | |
| Closed | Weaver Jason J | $126,432 |
Source: Public Records
Tax History
| Year | Tax Paid | Tax Assessment Tax Assessment Total Assessment is a certain percentage of the fair market value that is determined by local assessors to be the total taxable value of land and additions on the property. | Land | Improvement |
|---|---|---|---|---|
| 2026 | -- | $61,290 | $40,285 | $21,005 |
| 2024 | $1,000 | $58,171 | $37,485 | $20,686 |
| 2023 | $927 | $58,259 | $39,200 | $19,059 |
| 2022 | $900 | $46,999 | $31,500 | $15,499 |
| 2021 | $874 | $36,259 | $21,245 | $15,014 |
| 2020 | $806 | $33,754 | $19,985 | $13,769 |
| 2019 | $768 | $33,303 | $20,300 | $13,003 |
| 2018 | $733 | $26,955 | $14,455 | $12,500 |
| 2017 | $704 | $25,382 | $12,915 | $12,467 |
| 2016 | $1,616 | $23,809 | $11,340 | $12,469 |
| 2015 | $685 | $21,994 | $9,625 | $12,369 |
| 2014 | $664 | $20,292 | $8,575 | $11,717 |
| 2013 | -- | $17,493 | $6,125 | $11,368 |
Source: Public Records
Map
Nearby Homes
- 2295 Ellendale Rd
- 2050 Ives Ave
- 2050 Lassen Dr
- 1855 Ives Ave
- 1540 O Farrell St
- 1620 Harold Dr
- 1720 Grandview Ave
- 1695 Severn Dr
- 2645 Emily St
- 1495 Exeter Way
- 3160 Sky Country Dr
- 3221 Platte River Dr
- 2801 Kings Row
- 840 Brookfield Dr
- 1495 Doric Dr
- 1470 Marne Dr
- 3235 Bryan St
- 3020 Kings Row
- 3085 Kings Row
- 971 Melba Dr
- 2255 Ellendale Rd
- 1650 Peavine Rd
- 1660 Peavine Rd
- 2325 Ellendale Rd
- 2260 Ellendale Rd
- 2180 Gridley Ave
- 2245 Ellendale Rd
- 1670 Peavine Rd
- 2185 Gridley Ave
- 2355 Ellendale Rd
- 2150 Gridley Ave
- 2320 Cottage Ct
- 1635 Peavine Rd
- 1645 Peavine Rd
- 1655 Peavine Rd
- 1625 Peavine Rd
- 2225 Ellendale Rd
- 2350 Ellendale Rd
- 2375 Ellendale Rd Unit 1
- 1665 Peavine Rd
Your Personal Tour Guide
Ask me questions while you tour the home.