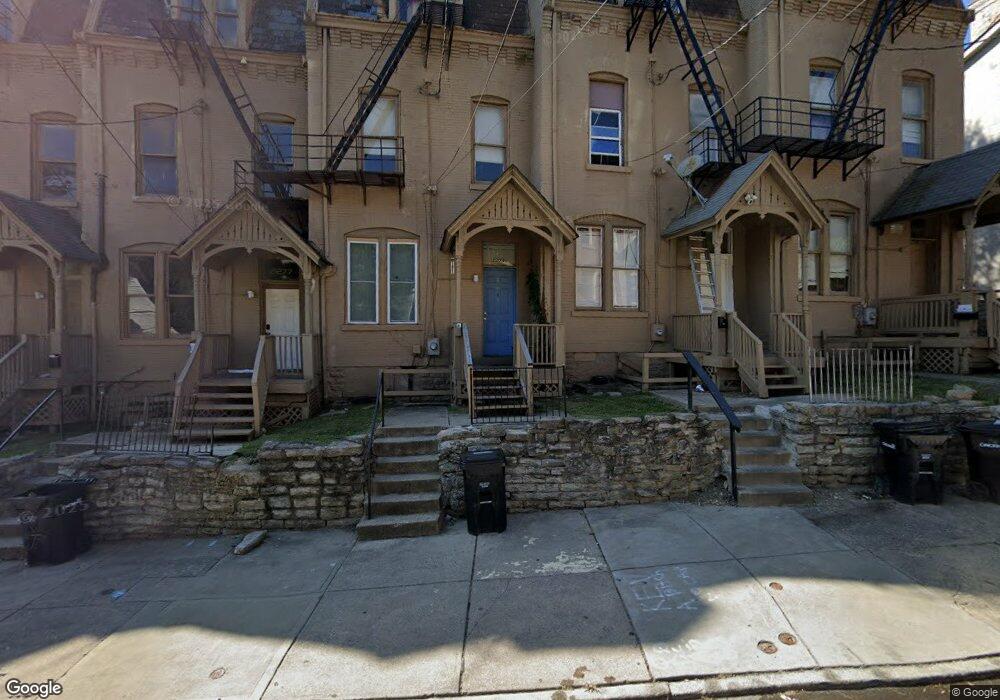
2279 Vine St Cincinnati, OH 45219
Clifton NeighborhoodEstimated Value: $182,000 - $329,000
4
Beds
2
Baths
2,268
Sq Ft
$115/Sq Ft
Est. Value
About This Home
This home is located at 2279 Vine St, Cincinnati, OH 45219 and is currently estimated at $260,245, approximately $114 per square foot. 2279 Vine St is a home located in Hamilton County with nearby schools including Clifton Area Neighborhood School, Robert A. Taft Information Technology High School, and Gilbert A. Dater High School.
Ownership History
Date
Name
Owned For
Owner Type
Purchase Details
Closed on
Jan 3, 2019
Sold by
Jacob Ben Shoushan Llc
Bought by
2265 83 Vine Investors Llc and Incubator Associates Limited Partnprship
Current Estimated Value
Purchase Details
Closed on
Mar 18, 2015
Sold by
Tubul Erez
Bought by
Jacob Ben Shoushan Llc
Purchase Details
Closed on
Dec 3, 2013
Sold by
Cincinnati Housing Limited Partnership
Bought by
Tubul Erez
Create a Home Valuation Report for This Property
The Home Valuation Report is an in-depth analysis detailing your home's value as well as a comparison with similar homes in the area
Home Values in the Area
Average Home Value in this Area
Purchase History
| Date | Buyer | Sale Price | Title Company |
|---|---|---|---|
| 2265 83 Vine Investors Llc | $725,000 | 360 American Title Services | |
| Jacob Ben Shoushan Llc | -- | Attorney | |
| Tubul Erez | $140,000 | American Homeland Title |
Source: Public Records
Tax History
| Year | Tax Paid | Tax Assessment Tax Assessment Total Assessment is a certain percentage of the fair market value that is determined by local assessors to be the total taxable value of land and additions on the property. | Land | Improvement |
|---|---|---|---|---|
| 2025 | $3,526 | $55,650 | $5,999 | $49,651 |
| 2023 | $4,530 | $71,484 | $5,999 | $65,485 |
| 2022 | $1,339 | $18,953 | $3,843 | $15,110 |
| 2021 | $1,315 | $18,953 | $3,843 | $15,110 |
| 2020 | $1,319 | $18,953 | $3,843 | $15,110 |
| 2019 | $1,425 | $16,626 | $3,371 | $13,255 |
| 2018 | $1,272 | $16,626 | $3,371 | $13,255 |
| 2017 | $3,688 | $50,145 | $3,371 | $46,774 |
| 2016 | $373 | $4,901 | $3,371 | $1,530 |
| 2015 | $333 | $4,901 | $3,371 | $1,530 |
| 2014 | $335 | $4,901 | $3,371 | $1,530 |
| 2013 | $1,064 | $15,401 | $3,371 | $12,030 |
Source: Public Records
Map
Nearby Homes
Your Personal Tour Guide
Ask me questions while you tour the home.