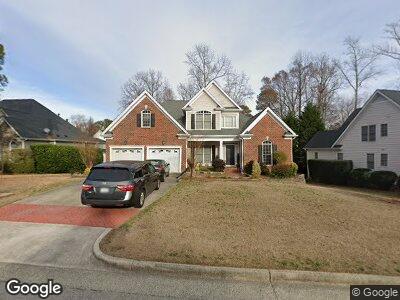
228 Billingrath Turn Ln Cary, NC 27519
West Cary NeighborhoodEstimated Value: $754,000 - $888,000
4
Beds
3
Baths
2,600
Sq Ft
$323/Sq Ft
Est. Value
About This Home
This home is located at 228 Billingrath Turn Ln, Cary, NC 27519 and is currently estimated at $840,882, approximately $323 per square foot. 228 Billingrath Turn Ln is a home located in Wake County with nearby schools including Salem Elementary, Salem Middle, and Green Hope High.
Ownership History
Date
Name
Owned For
Owner Type
Purchase Details
Closed on
Oct 25, 2002
Sold by
Olympus Servicing Lp
Bought by
Mustafa Syed I and Mustafa Rafat S
Current Estimated Value
Home Financials for this Owner
Home Financials are based on the most recent Mortgage that was taken out on this home.
Original Mortgage
$200,000
Interest Rate
5.42%
Purchase Details
Closed on
Apr 9, 2002
Sold by
Sims Ralph Alan
Bought by
Olympus Servicing Lp
Purchase Details
Closed on
Jul 3, 2001
Sold by
D & G Builders Inc
Bought by
Sims Ralph Allen
Home Financials for this Owner
Home Financials are based on the most recent Mortgage that was taken out on this home.
Original Mortgage
$349,600
Interest Rate
7.17%
Purchase Details
Closed on
May 22, 2000
Sold by
W & W Partners Inc
Bought by
D & G Builders Inc
Home Financials for this Owner
Home Financials are based on the most recent Mortgage that was taken out on this home.
Original Mortgage
$263,625
Interest Rate
8.14%
Create a Home Valuation Report for This Property
The Home Valuation Report is an in-depth analysis detailing your home's value as well as a comparison with similar homes in the area
Home Values in the Area
Average Home Value in this Area
Purchase History
| Date | Buyer | Sale Price | Title Company |
|---|---|---|---|
| Mustafa Syed I | $295,000 | -- | |
| Olympus Servicing Lp | $355,000 | -- | |
| Sims Ralph Allen | $368,000 | -- | |
| D & G Builders Inc | $57,000 | -- |
Source: Public Records
Mortgage History
| Date | Status | Borrower | Loan Amount |
|---|---|---|---|
| Closed | Mustafa Syed I | $200,000 | |
| Previous Owner | Sims Ralph Allen | $349,600 | |
| Previous Owner | D & G Builders Inc | $263,625 |
Source: Public Records
Tax History Compared to Growth
Tax History
| Year | Tax Paid | Tax Assessment Tax Assessment Total Assessment is a certain percentage of the fair market value that is determined by local assessors to be the total taxable value of land and additions on the property. | Land | Improvement |
|---|---|---|---|---|
| 2024 | $6,305 | $749,524 | $220,000 | $529,524 |
| 2023 | $4,844 | $481,396 | $90,000 | $391,396 |
| 2022 | $4,663 | $481,396 | $90,000 | $391,396 |
| 2021 | $4,569 | $481,396 | $90,000 | $391,396 |
| 2020 | $4,593 | $481,396 | $90,000 | $391,396 |
| 2019 | $4,988 | $463,987 | $90,000 | $373,987 |
| 2018 | $4,680 | $463,987 | $90,000 | $373,987 |
| 2017 | $4,497 | $463,987 | $90,000 | $373,987 |
| 2016 | $0 | $463,987 | $90,000 | $373,987 |
| 2015 | -- | $461,417 | $84,000 | $377,417 |
| 2014 | -- | $461,417 | $84,000 | $377,417 |
Source: Public Records
Map
Nearby Homes
- 216 Billingrath Turn Ln
- 213 Billingrath Turn Ln
- 205 Town Creek Dr
- 103 Trent Woods Way
- 100 Wentbridge Rd
- 102 Martins Point Place
- 102 Stagville Ct
- 1305 Holt Rd
- 421 Raven Cliff St
- 117 Whitehaven Ln
- 105 Cherry Grove Dr
- 802 Wakehurst Dr
- 2412 Castleburg Dr
- 402 Halls Mill Dr
- 216 Lewey Brook Dr
- 524 Rowanwood Way
- 1046 Upchurch Farm Ln
- 203 Halls Mill Dr
- 102 Downing Forest Place
- 1665 Wilde Bend
- 228 Billingrath Turn Ln
- 230 Billingrath Turn Ln
- 224 Billingrath Turn Ln
- 507 Burgwin Wright Way
- 229 Billingrath Turn Ln
- 505 Burgwin Wright Way
- 231 Billingrath Turn Ln
- 227 Billingrath Turn Ln
- 300 Billingrath Turn Ln
- 503 Burgwin Wright Way
- 214 Billingrath Turn Ln
- 225 Billingrath Turn Ln
- 101 Attmore Way
- 301 Billingrath Turn Ln
- 600 Burgwin Wright Way
- 223 Billingrath Turn Ln
- 221 Billingrath Turn Ln
- 204 Billingrath Turn Ln
- 210 Billingrath Turn Ln
- 100 Attmore Way