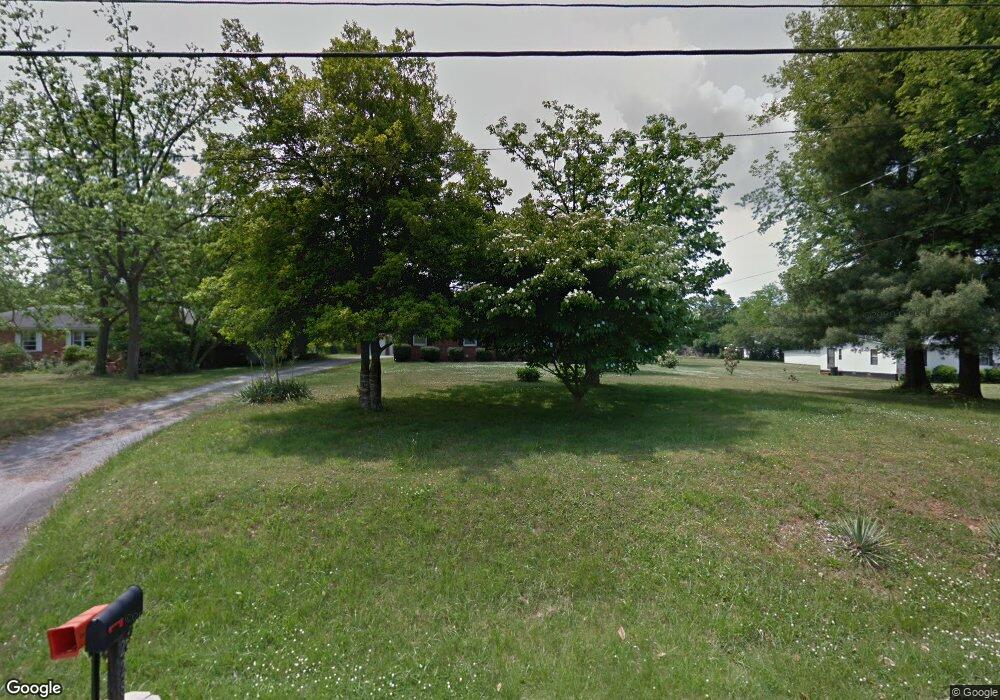
228 Compton Rd Murfreesboro, TN 37130
Estimated Value: $296,213 - $354,000
Studio
2
Baths
1,400
Sq Ft
$232/Sq Ft
Est. Value
About This Home
This home is located at 228 Compton Rd, Murfreesboro, TN 37130 and is currently estimated at $325,053, approximately $232 per square foot. 228 Compton Rd is a home located in Rutherford County with nearby schools including Walter Hill Elementary School, Oakland Middle School, and Oakland High School.
Ownership History
Date
Name
Owned For
Owner Type
Purchase Details
Closed on
Mar 12, 2007
Sold by
Reed Patricia M
Bought by
Reed Jamie L
Current Estimated Value
Purchase Details
Closed on
Sep 18, 2006
Sold by
Reed Terry A
Bought by
Reed Patricia M
Home Financials for this Owner
Home Financials are based on the most recent Mortgage that was taken out on this home.
Original Mortgage
$85,000
Interest Rate
6.48%
Purchase Details
Closed on
Jun 28, 2000
Sold by
Reed Winfred C
Bought by
Reed Terry A and Reed Patricia M
Purchase Details
Closed on
Jun 3, 1997
Sold by
Stefanski John L
Bought by
Reed Winfred C and Reed Margaret
Purchase Details
Closed on
Aug 2, 1995
Sold by
Smith C R
Bought by
Stefanski John L
Purchase Details
Closed on
Nov 2, 1993
Sold by
Howard Dement Paul
Bought by
Smith C R
Create a Home Valuation Report for This Property
The Home Valuation Report is an in-depth analysis detailing your home's value as well as a comparison with similar homes in the area
Home Values in the Area
Average Home Value in this Area
Purchase History
| Date | Buyer | Sale Price | Title Company |
|---|---|---|---|
| Reed Jamie L | $132,000 | -- | |
| Reed Patricia M | -- | -- | |
| Reed Terry A | $80,000 | -- | |
| Reed Winfred C | $89,000 | -- | |
| Stefanski John L | $85,000 | -- | |
| Smith C R | $67,500 | -- |
Source: Public Records
Mortgage History
| Date | Status | Borrower | Loan Amount |
|---|---|---|---|
| Previous Owner | Smith C R | $85,000 | |
| Previous Owner | Smith C R | $118,800 |
Source: Public Records
Tax History
| Year | Tax Paid | Tax Assessment Tax Assessment Total Assessment is a certain percentage of the fair market value that is determined by local assessors to be the total taxable value of land and additions on the property. | Land | Improvement |
|---|---|---|---|---|
| 2025 | $1,254 | $66,825 | $14,450 | $52,375 |
| 2024 | $1,254 | $66,825 | $14,450 | $52,375 |
| 2023 | $1,217 | $64,850 | $14,450 | $50,400 |
| 2022 | $1,048 | $64,850 | $14,450 | $50,400 |
| 2021 | $931 | $41,950 | $9,200 | $32,750 |
| 2020 | $931 | $41,950 | $9,200 | $32,750 |
| 2019 | $931 | $41,950 | $9,200 | $32,750 |
| 2018 | $881 | $41,950 | $0 | $0 |
| 2017 | $809 | $30,200 | $0 | $0 |
| 2016 | $809 | $30,200 | $0 | $0 |
| 2015 | $809 | $30,200 | $0 | $0 |
| 2014 | $751 | $30,200 | $0 | $0 |
| 2013 | -- | $22,225 | $0 | $0 |
Source: Public Records
Map
Nearby Homes
- 0 Thompson Rd Unit RTC3050461
- 0 Thompson Rd Unit RTC3030765
- 0 Thompson Rd Unit RTC2925050
- 305 Castlemere Ct
- 3220 Madison Ave
- 3430 Regency Park Dr
- 507 Kings Ridge Dr
- 2915 Suzanne Landon Dr
- 2913 Suzanne Landon Dr
- 2926 Roellen Rd
- 2900 Suzanne Landon Dr Unit G2
- 2900 Suzanne Landon Dr Unit D6
- 2900 Suzanne Landon Dr Unit D2
- 2900 Suzanne Landon Dr Unit L1
- 2900 Suzanne Landon Dr Unit F6
- 2900 Suzanne Landon Dr Unit H2
- 2900 Suzanne Landon Dr Unit F1
- 2900 Suzanne Landon Dr Unit G1
- 2900 Suzanne Landon Dr Unit H4
- 2900 Suzanne Landon Dr Unit F4
Your Personal Tour Guide
Ask me questions while you tour the home.