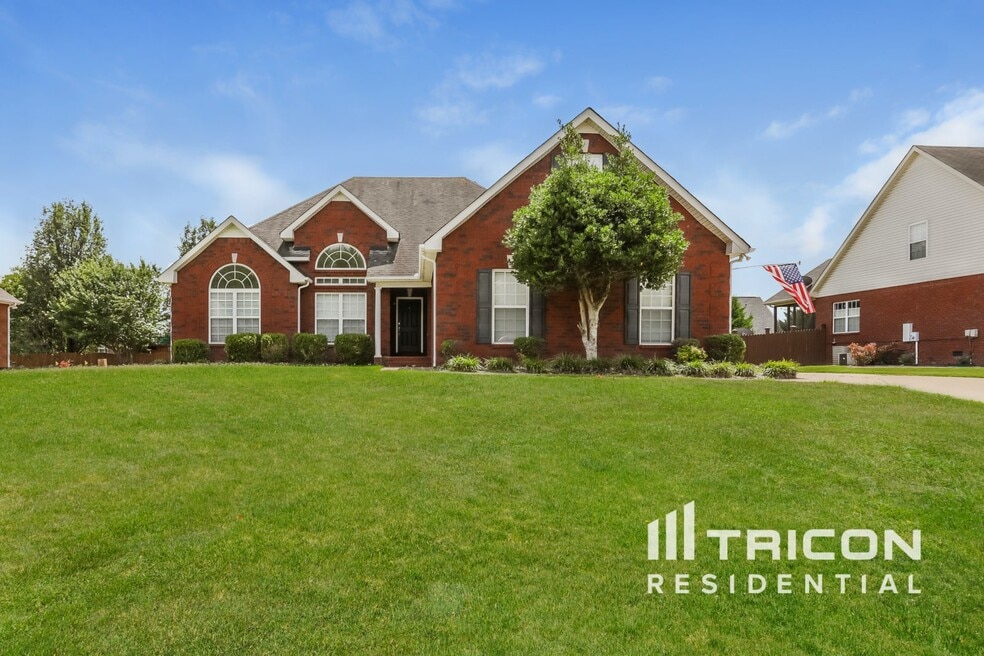
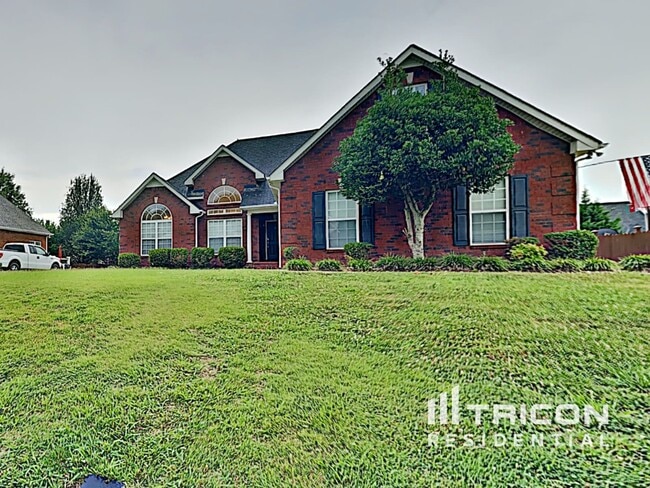
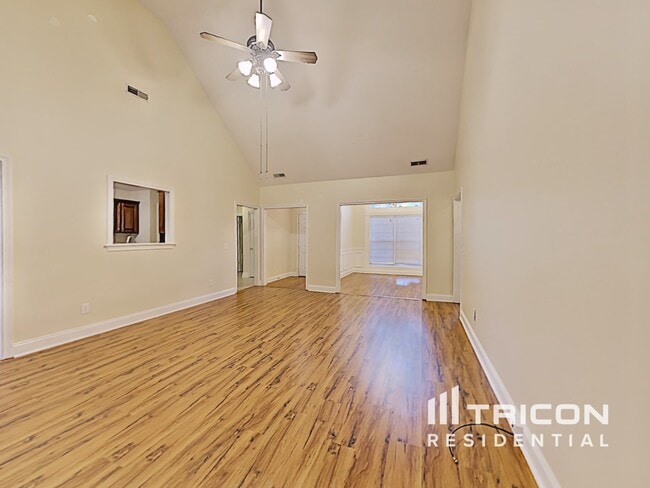
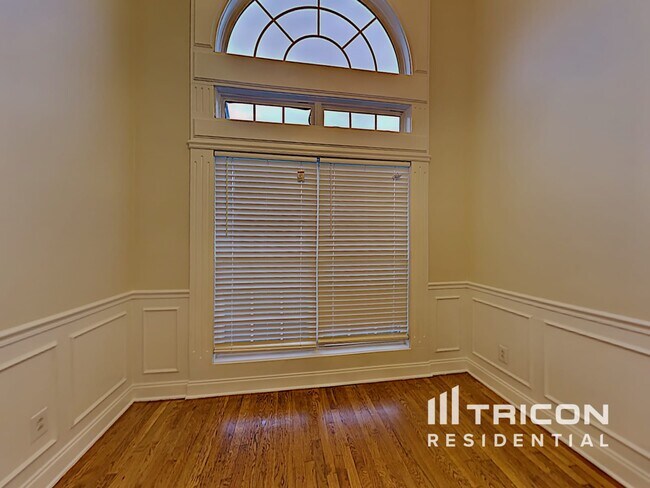
228 Forsyth St Murfreesboro, TN 37127
About This Home
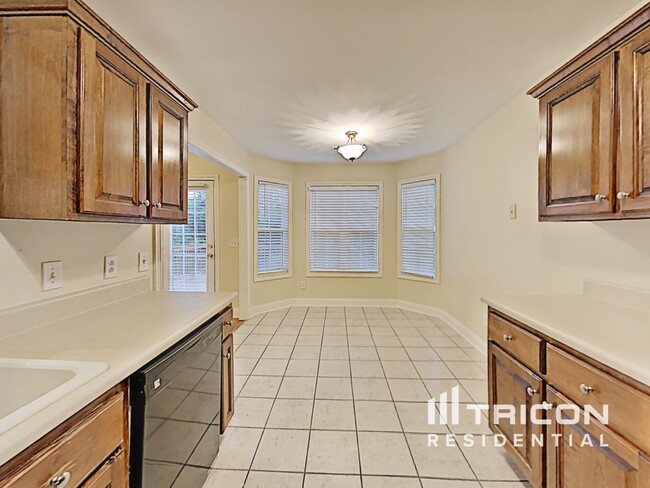
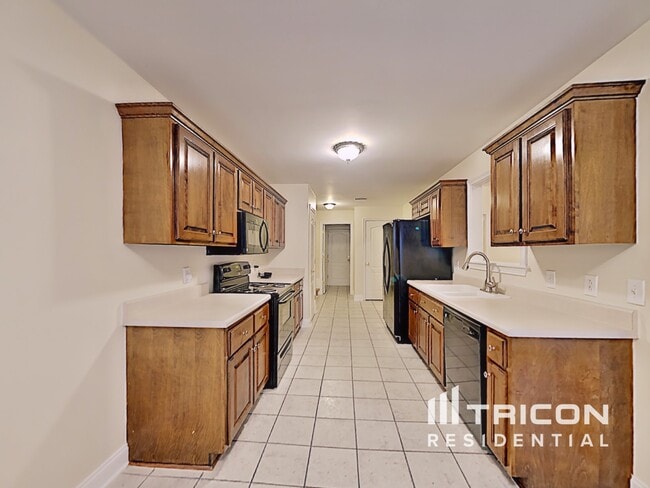
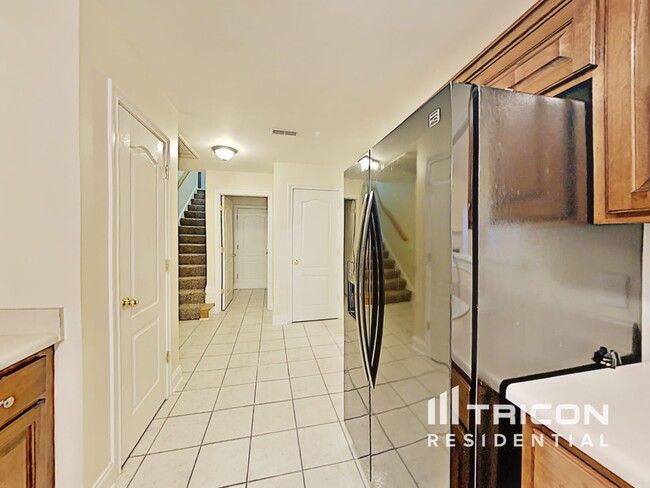
Coming soon - this home is currently being enjoyed by another resident but will be available soon. Pre-lease this home now with Tricon Pre-Lease Guarantee. This home is professionally managed by Tricon Residential, dedicated to creating exceptional rental experiences. Featuring 3 bedrooms, 2 bathrooms, and approximately 2,178 square feet, this well-maintained home offers a high standard of rental living, supported by a team that puts residents first. As a Tricon resident, you'll enjoy access to Tricon Vantage — a program designed to support your rental journey. Benefits include: (i) Our industry-first Resident Bill of Rights (outlining our commitment to an exceptional rental experience), (ii) free positive credit reporting, and (iii) up to $5,000 in down payment assistance after five years of residency. Tricon is proud to offer homes where residents feel supported — every step of the way.
- Please beware of leasing fraud! If someone other than an official Tricon Residential leasing agent attempts to rent you a home that is owned and professionally managed by Tricon Residential, please call our Fraud Prevention Hotline at or email us at . To learn more, visit
- This home may be in a community that has rental registration requirements. If so, please note that your move-in date may be delayed pending rental registration approval. Please consult with your leasing agent for more details.
- There is an application fee of $55 (or less depending on the state) per occupant aged 18 or older. Completed applications are considered on a “first-come, first-served” basis. There is a holding deposit of $250 per home, which is credited to the approved applicant’s first month’s rent after move-in, refunded if the application is denied, or forfeited if the move-in is canceled by an approved applicant. Approved applicants are required to execute a Lease Agreement and submit the full security deposit within 48 hours after approval of the Lease. The Lease start date must be within 10 days after approval (certain exceptions may apply at Tricon Single-Family Rental Communities). This requirement is applicable even if an approved applicant has not seen the inside of the home. Tricon Residential is proud to be an Equal Opportunity Housing Provider.
- Minimum lease term is one-year (13 mos. for homes in California). We collect a security deposit equal to one month’s rent for all new leases. Resident pays for all utilities including trash, sewer, and water.
- For homes with an available lease term greater than 18 months, a 3% annual base rent escalation will apply.
- Tricon is a pet-friendly housing provider. We accept most dogs, cats, birds, small caged mammals and fish. However, pets often have an impact on our homes which causes excessive wear and tear. That’s why we require a one-time fee of $300 for each pet (except in CA, CO, OR, WA, and WI), and $44 per month pet rent ($35 in Colorado).
- Pricing displayed reflects the lowest option for a given lease term and is deemed reliable but not guaranteed. Actual pricing will vary based on the options selected. We may revise the pricing for products and services we offer without prior notice.
- A Smart Home Fee of $21.95 per month applies to any home with Smart Home technology.
- A monthly Solar Fee will apply to certain homes equipped with a solar system; the fee varies by home. The energy generated by the solar systems can result in a credit to offset utility costs.
- An administrative fee is due prior to move-in. Other mandatory fees or charges may apply; review the Lease carefully for a full list of applicable fees and charges.
- Tricon makes every effort to display accurate home amenity charge information. However, on rare occasions, a home may have an amenity (and a related charge) that is not reflected on our website. To double-check the amenity charges for this home, please consult with your leasing agent.
- All Promotions are subject to the specific terms, conditions, and restrictions disclosed in connection therewith, and are subject to being changed or discontinued without notice. Photos are representative only and may not reflect the home’s current appliances or other features. If you have specific questions about a home’s features, please contact us. While we strive for accuracy, pricing, availability, and other listing information may include technical inaccuracies or typographical errors.
- Other terms and conditions apply. Refer to our online Terms of Agreement for more details.
- This home is equipped with in-home laundry appliances, which Tricon will provide and maintain. We charge $35 per month for homes with in-place washer/dryers.
Available After Nov 10, 2025

Map
- 206 Sayre Ln
- 2988 Barnstable Ct
- 122 Sayre Ln
- 2981 Taunton Ct
- 3008 Beaufort St
- 2822 Apache Moon Terrace
- 4582 Shelbyville Hwy
- 4598 Shelbyville Hwy
- 347 Sayre Ln
- 316 Black Bear Trail
- 2917 Chato Ct
- 3022 London View Dr
- 3220 Prater Ct
- 227 White Cloud Trail
- 3236 Prater Ct
- 235 Whiteamore Run
- 3018 Michalean Dr
- 312 Whiteamore Run
- 2729 Crazy Horse
- 509 Garden City Dr
- 189 Red Jacket Trace
- 131 Savannah Ridge
- 237 Titans Cir
- 3023 London View Dr
- 447 Titans Cir
- 167 Lansdan Dr
- 2710 Soaring Eagle Ct
- 261 Veterans Pkwy
- 227 Meigs Dr
- 132 Lynnford Dr
- 519 Joe B Jackson Pkwy
- 2840 S Church St
- 3544 Dorothy Dr
- 537 County Farm Rd
- 2650 Merchants Walk
- 262 Arapaho Dr
- 346 Shoshone Place
- 354 Arapaho Dr
- 2805 Painted Pony Dr
- 610 Hogan Dr