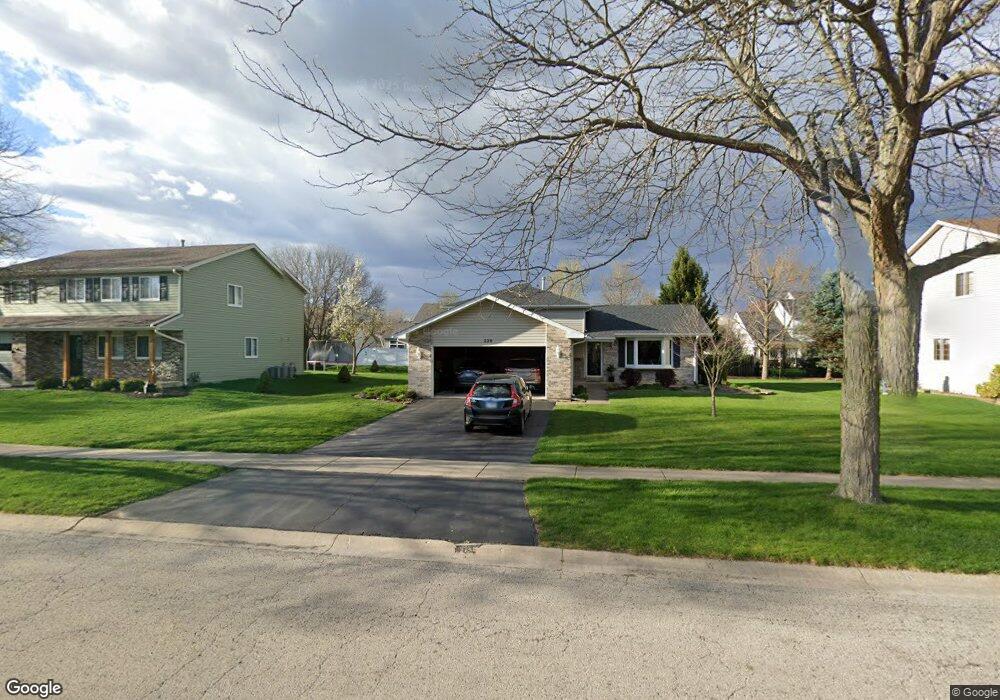
228 Fox Chase Dr N Oswego, IL 60543
Northwest Oswego NeighborhoodEstimated Value: $335,000 - $365,000
3
Beds
2
Baths
1,171
Sq Ft
$295/Sq Ft
Est. Value
About This Home
This home is located at 228 Fox Chase Dr N, Oswego, IL 60543 and is currently estimated at $345,639, approximately $295 per square foot. 228 Fox Chase Dr N is a home located in Kendall County with nearby schools including Fox Chase Elementary School, Traughber Junior High School, and Oswego High School.
Ownership History
Date
Name
Owned For
Owner Type
Purchase Details
Closed on
Jan 29, 2004
Sold by
Hauser Brian K and Hauser Melissa
Bought by
Baker John F and Baker Connie S
Current Estimated Value
Home Financials for this Owner
Home Financials are based on the most recent Mortgage that was taken out on this home.
Original Mortgage
$176,000
Outstanding Balance
$82,027
Interest Rate
5.74%
Mortgage Type
Purchase Money Mortgage
Estimated Equity
$263,612
Purchase Details
Closed on
Mar 27, 2000
Sold by
Probst James J and Probst Julie H
Bought by
Hauser Brian K and Hauser Melissa L
Home Financials for this Owner
Home Financials are based on the most recent Mortgage that was taken out on this home.
Original Mortgage
$125,000
Interest Rate
8.31%
Purchase Details
Closed on
Sep 1, 1995
Bought by
Probst James J and Probst Julie H
Purchase Details
Closed on
Oct 1, 1993
Bought by
Diemer Sidney
Create a Home Valuation Report for This Property
The Home Valuation Report is an in-depth analysis detailing your home's value as well as a comparison with similar homes in the area
Home Values in the Area
Average Home Value in this Area
Purchase History
| Date | Buyer | Sale Price | Title Company |
|---|---|---|---|
| Baker John F | $220,000 | First American Title | |
| Hauser Brian K | $149,000 | Chicago Title Insurance Co | |
| Probst James J | $133,200 | -- | |
| Diemer Sidney | $119,900 | -- |
Source: Public Records
Mortgage History
| Date | Status | Borrower | Loan Amount |
|---|---|---|---|
| Open | Baker John F | $176,000 | |
| Previous Owner | Hauser Brian K | $125,000 | |
| Closed | Diemer Sidney | -- |
Source: Public Records
Tax History
| Year | Tax Paid | Tax Assessment Tax Assessment Total Assessment is a certain percentage of the fair market value that is determined by local assessors to be the total taxable value of land and additions on the property. | Land | Improvement |
|---|---|---|---|---|
| 2024 | $7,177 | $95,188 | $14,485 | $80,703 |
| 2023 | $6,499 | $84,989 | $12,933 | $72,056 |
| 2022 | $6,499 | $77,971 | $11,865 | $66,106 |
| 2021 | $6,387 | $74,258 | $11,300 | $62,958 |
| 2020 | $6,380 | $73,523 | $11,188 | $62,335 |
| 2019 | $6,038 | $68,906 | $11,188 | $57,718 |
| 2018 | $5,787 | $67,748 | $11,000 | $56,748 |
| 2017 | $5,401 | $58,685 | $6,623 | $52,062 |
| 2016 | $5,512 | $58,999 | $17,007 | $41,992 |
| 2015 | $5,144 | $53,153 | $15,322 | $37,831 |
| 2014 | -- | $50,145 | $14,455 | $35,690 |
| 2013 | -- | $50,652 | $14,601 | $36,051 |
Source: Public Records
Map
Nearby Homes
- 130 Fox Chase Dr S
- 1415 State Route 31
- 116 River Mist Dr
- 123 Fox Chase Dr S
- 133 River Mist Dr Unit 3
- 135 River Mist Dr Unit 2
- 404 Beaver Ct Unit 3
- 2300 Light Rd Unit 202
- 2110 State Route 31
- 104 Augusta Rd
- 2400 Light Rd Unit 207
- 2240 State Route 31
- 303 Fox Chase Dr N
- 505 Parkland Ct
- 303 Owen Ct
- 7.43 Acres Vacant La State Route 31
- 115 Harbor Dr
- 117 Presidential Blvd Unit 3244
- 125 Presidential Blvd Unit 3248
- 6 E Anchor Dr
- 230 Fox Chase Dr N
- 226 Fox Chase Dr N
- 411 Lennox Dr Unit 1
- 413 Lennox Dr Unit 1
- 409 Lennox Dr Unit 1
- 224 Fox Chase Dr N Unit 1
- 232 Fox Chase Dr N Unit 1
- 241 Whitetail Crossing
- 415 Lennox Dr Unit 1
- 229 Fox Chase Dr N
- 231 Fox Chase Dr N
- 222 Fox Chase Dr N Unit 1
- 234 Fox Chase Dr N
- 417 Lennox Dr Unit 1
- 239 Whitetail Crossing
- 223 Fox Chase Dr N
- 405 Lennox Ct Unit 1
- 233 Fox Chase Dr N Unit 1
- 419 Lennox Dr Unit 1
- 220 Fox Chase Dr N Unit 1
Your Personal Tour Guide
Ask me questions while you tour the home.