228 Wine St Charlottesville, VA 22902
North Downtown NeighborhoodEstimated Value: $691,069 - $909,000
2
Beds
2
Baths
1,352
Sq Ft
$573/Sq Ft
Est. Value
About This Home
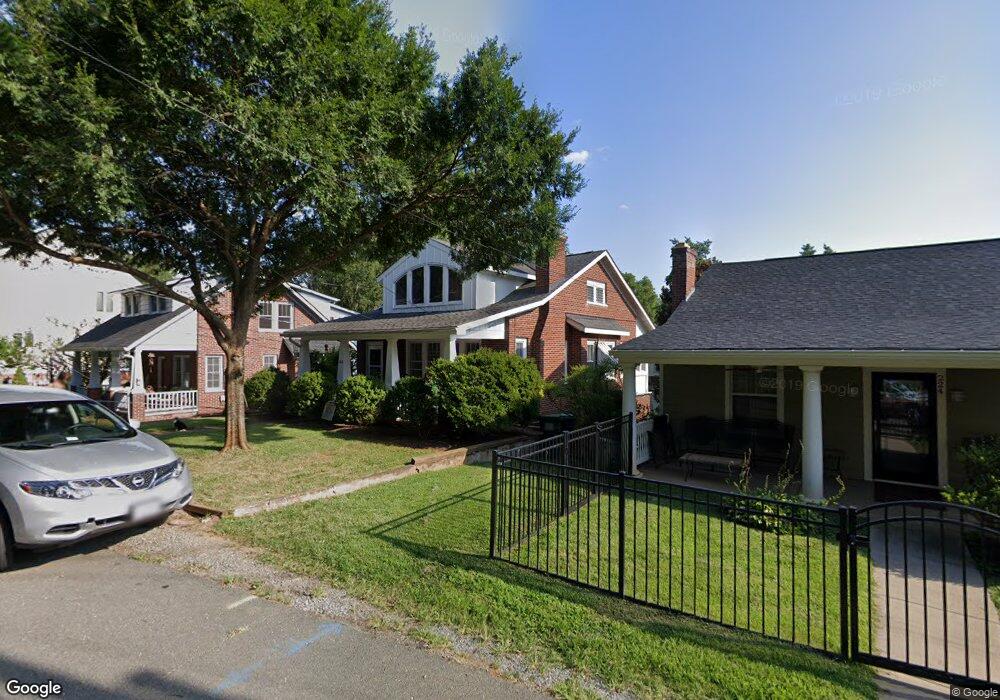
This home is located at 228 Wine St, Charlottesville, VA 22902 and is currently estimated at $775,017, approximately $573 per square foot. 228 Wine St is a home located in Charlottesville City with nearby schools including Burnley-Moran Elementary School, Buford Middle School, and Charlottesville High School.
Ownership History
Date
Name
Owned For
Owner Type
Purchase Details
Closed on
May 18, 2016
Sold by
Duffy Pappas
Bought by
Herz Harold K
Current Estimated Value
Home Financials for this Owner
Home Financials are based on the most recent Mortgage that was taken out on this home.
Original Mortgage
$360,000
Interest Rate
3.59%
Mortgage Type
New Conventional
Purchase Details
Closed on
Apr 6, 2000
Bought by
Pappas Duffy
Create a Home Valuation Report for This Property
The Home Valuation Report is an in-depth analysis detailing your home's value as well as a comparison with similar homes in the area
Home Values in the Area
Average Home Value in this Area
Purchase History
| Date | Buyer | Sale Price | Title Company |
|---|---|---|---|
| Herz Harold K | $400,000 | Chicago Title Ins Co | |
| Pappas Duffy | $158,000 | -- |
Source: Public Records
Mortgage History
| Date | Status | Borrower | Loan Amount |
|---|---|---|---|
| Closed | Herz Harold K | $360,000 |
Source: Public Records
Tax History Compared to Growth
Tax History
| Year | Tax Paid | Tax Assessment Tax Assessment Total Assessment is a certain percentage of the fair market value that is determined by local assessors to be the total taxable value of land and additions on the property. | Land | Improvement |
|---|---|---|---|---|
| 2025 | $6,617 | $667,900 | $237,500 | $430,400 |
| 2024 | $6,617 | $571,700 | $209,000 | $362,700 |
| 2023 | $5,442 | $559,400 | $209,000 | $350,400 |
| 2022 | $5,126 | $526,500 | $199,500 | $327,000 |
| 2021 | $4,758 | $493,300 | $178,100 | $315,200 |
| 2020 | $4,440 | $459,800 | $174,500 | $285,300 |
| 2019 | $4,338 | $449,100 | $169,400 | $279,700 |
| 2018 | $2,001 | $413,700 | $147,300 | $266,400 |
| 2017 | $3,754 | $387,600 | $133,900 | $253,700 |
| 2016 | $3,290 | $366,400 | $121,700 | $244,700 |
| 2015 | $3,290 | $366,400 | $121,700 | $244,700 |
| 2014 | $3,290 | $346,300 | $108,700 | $237,600 |
Source: Public Records
Map
Nearby Homes
- 503 2nd St NE
- 511 1st St N Unit 613
- 511 1st St N Unit 105
- 511 N 1st St Unit 613
- 511 N 1st St Unit 105
- 409 Park St
- 113 Altamont Cir
- 410 Altamont Cir
- 615 E High St
- 619 E High St
- 619 E High St Unit 2
- 249 E Jefferson St Unit 2526
- 253 E Jefferson St Unit 27
- 501 Lexington Ave
- 500 Court Square Unit 505
- 500 Court Square Unit 901
- 500 Court Square Unit 503 AND 504