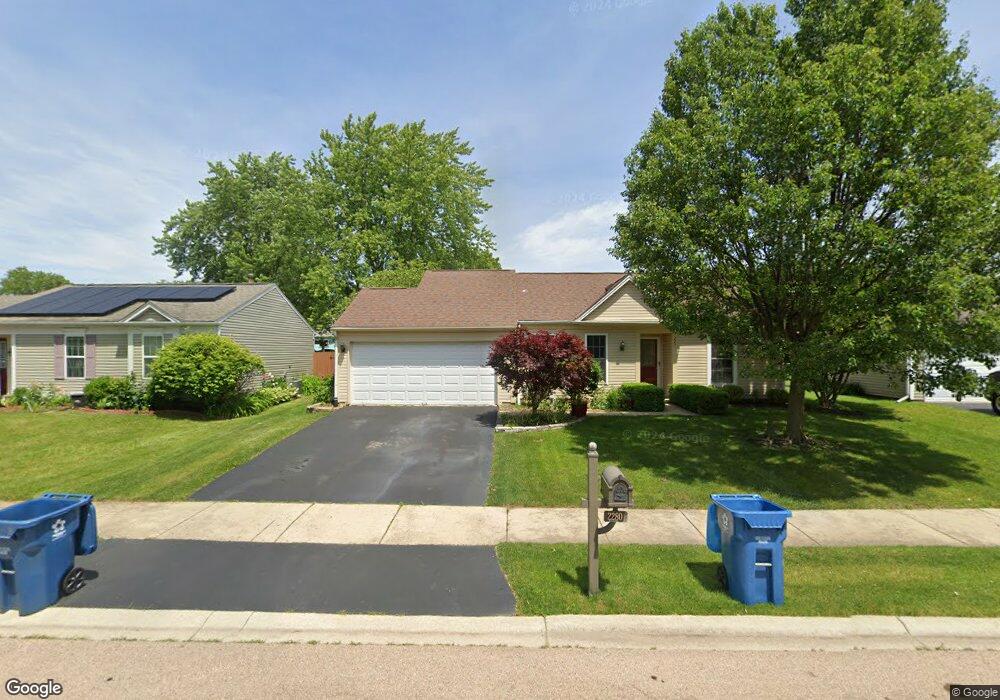
2280 S Crescent Ln Unit 9 Aurora, IL 60504
South East Village NeighborhoodEstimated Value: $294,000 - $327,000
3
Beds
2
Baths
1,040
Sq Ft
$302/Sq Ft
Est. Value
About This Home
This home is located at 2280 S Crescent Ln Unit 9, Aurora, IL 60504 and is currently estimated at $314,317, approximately $302 per square foot. 2280 S Crescent Ln Unit 9 is a home located in DuPage County with nearby schools including Georgetown Elementary School, Fischer Middle School, and Waubonsie Valley High School.
Ownership History
Date
Name
Owned For
Owner Type
Purchase Details
Closed on
Aug 31, 2006
Sold by
Sevilla Ruby and Rubio Jorge
Bought by
Garcia Martin and Garcia Maria G
Current Estimated Value
Home Financials for this Owner
Home Financials are based on the most recent Mortgage that was taken out on this home.
Original Mortgage
$184,500
Outstanding Balance
$110,980
Interest Rate
6.7%
Mortgage Type
Purchase Money Mortgage
Estimated Equity
$203,337
Purchase Details
Closed on
Aug 4, 2003
Sold by
Bowler Stephen W and Bowler Elizabeth A
Bought by
Rubio Jorge and Sevilla Ruby
Home Financials for this Owner
Home Financials are based on the most recent Mortgage that was taken out on this home.
Original Mortgage
$160,481
Interest Rate
6.33%
Mortgage Type
FHA
Purchase Details
Closed on
May 29, 1998
Sold by
Hetherington Daniel J and Hetherington Sandra A
Bought by
Bowler Stephen W and Bowler Elizabeth A
Home Financials for this Owner
Home Financials are based on the most recent Mortgage that was taken out on this home.
Original Mortgage
$114,952
Interest Rate
7.27%
Mortgage Type
FHA
Create a Home Valuation Report for This Property
The Home Valuation Report is an in-depth analysis detailing your home's value as well as a comparison with similar homes in the area
Home Values in the Area
Average Home Value in this Area
Purchase History
| Date | Buyer | Sale Price | Title Company |
|---|---|---|---|
| Garcia Martin | $184,500 | Chicago Title Insurance Co | |
| Rubio Jorge | $163,000 | Pntn | |
| Bowler Stephen W | $116,000 | -- |
Source: Public Records
Mortgage History
| Date | Status | Borrower | Loan Amount |
|---|---|---|---|
| Open | Garcia Martin | $184,500 | |
| Previous Owner | Rubio Jorge | $160,481 | |
| Previous Owner | Bowler Stephen W | $114,952 |
Source: Public Records
Tax History Compared to Growth
Tax History
| Year | Tax Paid | Tax Assessment Tax Assessment Total Assessment is a certain percentage of the fair market value that is determined by local assessors to be the total taxable value of land and additions on the property. | Land | Improvement |
|---|---|---|---|---|
| 2024 | $5,222 | $76,678 | $27,466 | $49,212 |
| 2023 | $4,949 | $68,900 | $24,680 | $44,220 |
| 2022 | $4,637 | $61,290 | $21,800 | $39,490 |
| 2021 | $4,505 | $59,100 | $21,020 | $38,080 |
| 2020 | $4,560 | $59,100 | $21,020 | $38,080 |
| 2019 | $4,386 | $56,210 | $19,990 | $36,220 |
| 2018 | $4,256 | $54,190 | $19,140 | $35,050 |
| 2017 | $4,176 | $52,350 | $18,490 | $33,860 |
| 2016 | $4,090 | $50,230 | $17,740 | $32,490 |
| 2015 | $4,033 | $47,690 | $16,840 | $30,850 |
| 2014 | $4,243 | $48,590 | $17,040 | $31,550 |
| 2013 | $4,202 | $48,930 | $17,160 | $31,770 |
Source: Public Records
Map
Nearby Homes
- 2297 Lakeside Dr Unit 10
- 1629 Silver Springs Ct
- 2476 Village Ct Unit 2
- 2632 Emma Cir
- 2489 Rosehall Ln
- 2509 Rosehall Ln
- 1875 Keating Dr
- 1871 Keating Dr
- 1335 Lawrence Ct
- 1855 Keating Dr
- 2730 Dorothy Dr Unit 1
- 1465 Bridgeport Ln Unit 19D
- 1966 Congrove Dr
- 2723 Rosehall Ln
- 2860 Bridgeport Ln Unit 19D
- Bellamy Plan at Wheatland Crossing
- Henley Plan at Wheatland Crossing
- Ashton Plan at Wheatland Crossing
- Coventry Plan at Wheatland Crossing
- 1870 Canyon Creek Dr
- 2270 S Crescent Ln Unit 9
- 2290 S Crescent Ln
- 2263 Highfield Ln
- 2260 S Crescent Ln Unit 9
- 2259 Highfield Ln
- 2269 Highfield Ln
- 2285 S Crescent Ln
- 2300 S Crescent Ln Unit 9
- 2275 S Crescent Ln
- 2255 Highfield Ln Unit 9
- 2250 S Crescent Ln Unit 9
- 2275 Highfield Ln Unit 9
- 2295 Bannister Ln
- 2249 Highfield Ln Unit 9
- 2290 Bannister Ln
- 2265 S Crescent Ln Unit 9
- 2240 S Crescent Ln
- 2255 S Crescent Ln Unit 9
- 2258 Highfield Ln Unit 9
- 2245 Highfield Ln