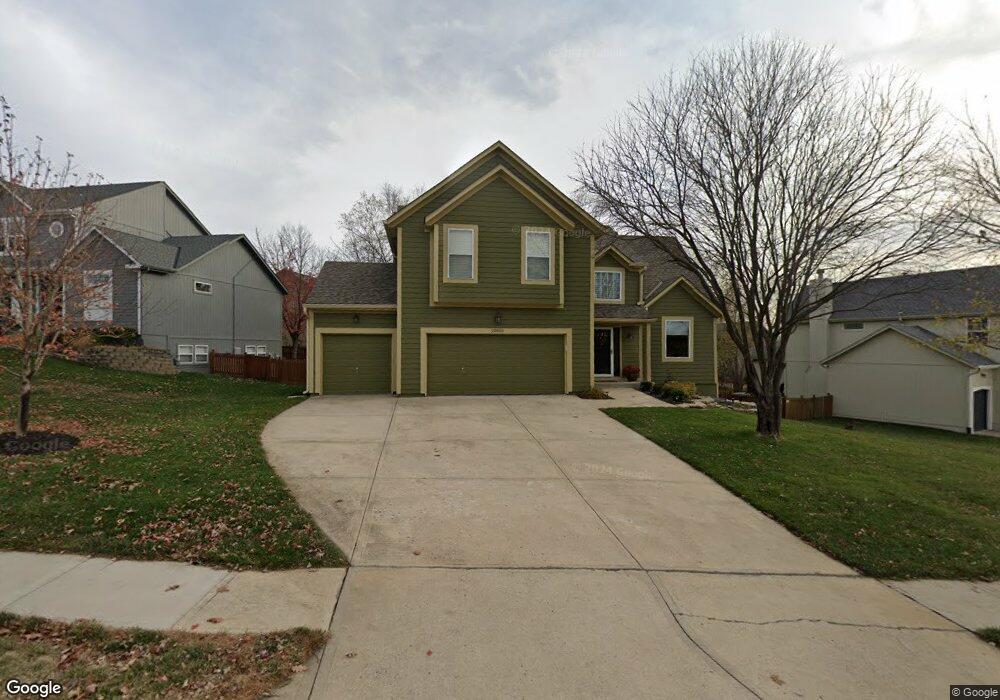
22805 W 49th St Shawnee, KS 66226
Estimated Value: $442,000 - $463,000
4
Beds
3
Baths
2,150
Sq Ft
$210/Sq Ft
Est. Value
About This Home
This home is located at 22805 W 49th St, Shawnee, KS 66226 and is currently estimated at $452,256, approximately $210 per square foot. 22805 W 49th St is a home located in Johnson County with nearby schools including Prairie Ridge Elementary School, Monticello Trails Middle School, and Mill Valley High School.
Ownership History
Date
Name
Owned For
Owner Type
Purchase Details
Closed on
Dec 4, 2020
Sold by
Fenton John C and Perry Debra M
Bought by
Fenton John C and Perry Debra M
Current Estimated Value
Home Financials for this Owner
Home Financials are based on the most recent Mortgage that was taken out on this home.
Original Mortgage
$175,000
Outstanding Balance
$155,369
Interest Rate
2.8%
Mortgage Type
New Conventional
Estimated Equity
$296,887
Purchase Details
Closed on
Feb 22, 2009
Sold by
Fenton Tanya P
Bought by
Fenton John C
Purchase Details
Closed on
Jun 4, 2001
Sold by
Sunrise Builders Llc
Bought by
Fenton John C and Fenton Tanya P
Home Financials for this Owner
Home Financials are based on the most recent Mortgage that was taken out on this home.
Original Mortgage
$193,073
Interest Rate
7.5%
Create a Home Valuation Report for This Property
The Home Valuation Report is an in-depth analysis detailing your home's value as well as a comparison with similar homes in the area
Home Values in the Area
Average Home Value in this Area
Purchase History
| Date | Buyer | Sale Price | Title Company |
|---|---|---|---|
| Fenton John C | -- | Stewart Title Company | |
| Fenton John C | -- | None Available | |
| Fenton John C | -- | Security Land Title Company |
Source: Public Records
Mortgage History
| Date | Status | Borrower | Loan Amount |
|---|---|---|---|
| Open | Fenton John C | $175,000 | |
| Closed | Fenton John C | $193,073 |
Source: Public Records
Tax History Compared to Growth
Tax History
| Year | Tax Paid | Tax Assessment Tax Assessment Total Assessment is a certain percentage of the fair market value that is determined by local assessors to be the total taxable value of land and additions on the property. | Land | Improvement |
|---|---|---|---|---|
| 2024 | $5,305 | $45,667 | $8,747 | $36,920 |
| 2023 | $5,345 | $45,460 | $8,747 | $36,713 |
| 2022 | $4,653 | $38,790 | $7,604 | $31,186 |
| 2021 | $4,653 | $36,616 | $7,604 | $29,012 |
| 2020 | $4,280 | $33,948 | $6,916 | $27,032 |
| 2019 | $4,196 | $32,798 | $6,013 | $26,785 |
| 2018 | $3,922 | $30,371 | $6,013 | $24,358 |
| 2017 | $3,871 | $29,245 | $5,226 | $24,019 |
| 2016 | $3,777 | $28,186 | $4,971 | $23,215 |
| 2015 | $3,769 | $27,669 | $4,971 | $22,698 |
| 2013 | -- | $24,725 | $4,971 | $19,754 |
Source: Public Records
Map
Nearby Homes
- 22714 W 49th St
- 22910 W 51st St
- 22625 W 49th St
- 22912 W 47th Terrace
- 22611 W 46th Terrace
- 5005 Hilltop Dr
- 4638 Aminda St
- 5221 Meadow View Dr
- 22014 W 51st St
- 5116 Payne St
- 22115 W 51st Terrace
- 22014 W 47th Terrace
- 4420 Anderson St
- 5137 Meadowlark Dr
- 4403 Silverheel St
- 9307 Aminda St
- 9303 Aminda St
- 9313 Aminda St
- 9305 Aminda St
- 5206 Round Prairie St
- 22907 W 49th St
- 22801 W 49th St
- 4904 Woodsonia Dr
- 22910 W 50th St
- 22804 W 49th St
- 22914 W 50th St
- 22902 W 49th St
- 4908 Woodsonia Dr
- 22800 W 49th St
- 22717 W 49th St
- 22914 W 49th St
- 22910 W 49th St
- 22906 W 50th St
- 4912 Woodsonia Dr
- 22714 W 49th Terrace
- 22918 W 49th St
- 22903 W 48th Terrace
- 22718 W 49th St
- 22906 W 49th St
- 22907 W 48th Terrace