Estimated Value: $694,822 - $759,000
3
Beds
1
Bath
1,040
Sq Ft
$704/Sq Ft
Est. Value
About This Home
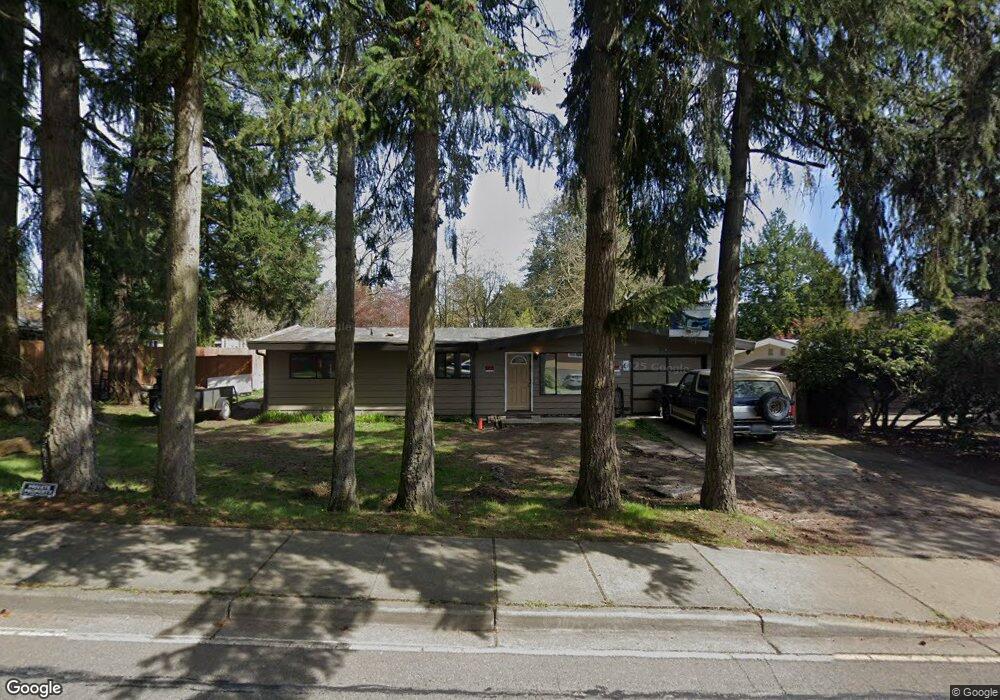
This home is located at 22815 34th Ave W, Brier, WA 98036 and is currently estimated at $732,456, approximately $704 per square foot. 22815 34th Ave W is a home located in Snohomish County with nearby schools including Brier Elementary School, Brier Terrace Middle School, and Mountlake Terrace High School.
Ownership History
Date
Name
Owned For
Owner Type
Purchase Details
Closed on
Dec 19, 2002
Sold by
Herd Klaus G and Herd Clause G
Bought by
Herd Klaus G
Current Estimated Value
Home Financials for this Owner
Home Financials are based on the most recent Mortgage that was taken out on this home.
Original Mortgage
$179,589
Outstanding Balance
$75,030
Interest Rate
5.86%
Mortgage Type
FHA
Estimated Equity
$657,426
Purchase Details
Closed on
Nov 17, 2000
Sold by
Lewis James Scott and Lewis Tracy Marie
Bought by
Herd Clause G
Home Financials for this Owner
Home Financials are based on the most recent Mortgage that was taken out on this home.
Original Mortgage
$178,528
Interest Rate
7.82%
Purchase Details
Closed on
Jul 11, 1994
Sold by
Carlson Steve N and Carlson Jeanette A
Bought by
Lewis James Scott and Lewis Tracy Marie
Home Financials for this Owner
Home Financials are based on the most recent Mortgage that was taken out on this home.
Original Mortgage
$115,850
Interest Rate
4.5%
Create a Home Valuation Report for This Property
The Home Valuation Report is an in-depth analysis detailing your home's value as well as a comparison with similar homes in the area
Home Values in the Area
Average Home Value in this Area
Purchase History
| Date | Buyer | Sale Price | Title Company |
|---|---|---|---|
| Herd Klaus G | $28,089 | Chicago | |
| Herd Clause G | $180,000 | -- | |
| Lewis James Scott | $121,950 | -- |
Source: Public Records
Mortgage History
| Date | Status | Borrower | Loan Amount |
|---|---|---|---|
| Open | Herd Klaus G | $179,589 | |
| Closed | Herd Clause G | $178,528 | |
| Previous Owner | Lewis James Scott | $115,850 |
Source: Public Records
Tax History Compared to Growth
Tax History
| Year | Tax Paid | Tax Assessment Tax Assessment Total Assessment is a certain percentage of the fair market value that is determined by local assessors to be the total taxable value of land and additions on the property. | Land | Improvement |
|---|---|---|---|---|
| 2025 | $4,947 | $667,100 | $543,800 | $123,300 |
| 2024 | $4,947 | $626,800 | $503,500 | $123,300 |
| 2023 | $4,803 | $730,600 | $601,400 | $129,200 |
| 2022 | $3,930 | $485,300 | $375,800 | $109,500 |
| 2020 | $3,843 | $423,500 | $326,500 | $97,000 |
| 2019 | $3,187 | $352,100 | $256,700 | $95,400 |
| 2018 | $3,426 | $327,900 | $242,800 | $85,100 |
| 2017 | $2,720 | $272,900 | $196,300 | $76,600 |
| 2016 | $2,345 | $237,300 | $163,700 | $73,600 |
| 2015 | $2,313 | $219,200 | $149,000 | $70,200 |
| 2013 | $1,890 | $169,000 | $105,800 | $63,200 |
Source: Public Records
Map
Nearby Homes
- 22841 32nd Ave W
- 22824 35th Ave W
- 3113 232nd St SW
- 3001 227th St SW
- 23200 29th Ave W
- 22912 39th Ave W
- 2723 232nd St SW
- 4009 229th Place SW
- 22301 Old Poplar Way
- 22603 41st Place W
- 23726 35th Ave W
- 22303 Old Poplar Way
- 22010 Brier Rd
- 23325 Cedar Way Unit G105
- 23301 Cedar Way Unit U102
- 3232 Russet Rd
- 23319 Cedar Way Unit K105
- 22301 42nd Place W
- 22638 44th Ave W Unit 6
- 21617 Poplar Way
- 22825 34th Ave W
- 3306 228th St SW
- 22901 34th Ave W
- 22808 34th Ave W
- 22810 32nd Ave W
- 22806 32nd Ave W
- 22900 32nd Ave W
- 22816 34th Ave W
- 22818 34th Ave W
- 22911 34th Ave W
- 3307 228th St SW
- 22906 32nd Ave W
- 3201 228th St SW
- 3309 228th St SW
- 3333 228th St SW Unit 72
- 22908 34th Ave W
- 3330 227th St SW
- 22807 32nd Ave W
- 22919 34th Ave W
- 22805 32nd Ave W