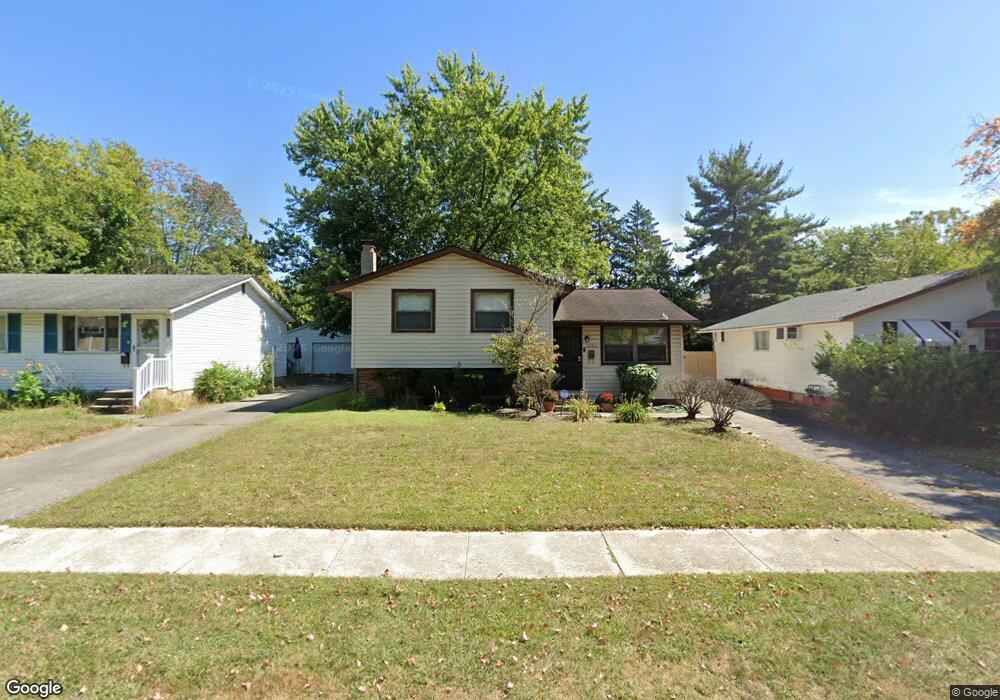
2282 Cardston Dr Columbus, OH 43232
Glenbrook NeighborhoodEstimated Value: $173,000 - $219,116
4
Beds
2
Baths
1,144
Sq Ft
$178/Sq Ft
Est. Value
About This Home
This home is located at 2282 Cardston Dr, Columbus, OH 43232 and is currently estimated at $203,529, approximately $177 per square foot. 2282 Cardston Dr is a home located in Franklin County with nearby schools including Easthaven Elementary School, Yorktown Middle School, and Independence High School.
Ownership History
Date
Name
Owned For
Owner Type
Purchase Details
Closed on
Jun 2, 1999
Sold by
Chicago Nbd Mtg Incorporated
Bought by
Radford Tina M
Current Estimated Value
Home Financials for this Owner
Home Financials are based on the most recent Mortgage that was taken out on this home.
Original Mortgage
$64,485
Outstanding Balance
$17,021
Interest Rate
7.06%
Mortgage Type
FHA
Estimated Equity
$186,508
Purchase Details
Closed on
Mar 29, 1999
Sold by
Federal National Mortgage Association
Bought by
Nbd Bank
Purchase Details
Closed on
Aug 10, 1998
Sold by
Dye Thaddeus R and First Chicago Nbd Mtg
Bought by
Federal National Mortgage Association
Purchase Details
Closed on
Aug 24, 1995
Sold by
Maple Larry
Bought by
Thaddeus R Dye
Home Financials for this Owner
Home Financials are based on the most recent Mortgage that was taken out on this home.
Original Mortgage
$66,400
Interest Rate
7.43%
Mortgage Type
New Conventional
Purchase Details
Closed on
Feb 1, 1977
Create a Home Valuation Report for This Property
The Home Valuation Report is an in-depth analysis detailing your home's value as well as a comparison with similar homes in the area
Home Values in the Area
Average Home Value in this Area
Purchase History
| Date | Buyer | Sale Price | Title Company |
|---|---|---|---|
| Radford Tina M | $65,000 | Title First Agency Inc | |
| Nbd Bank | -- | Title First Agency Inc | |
| Federal National Mortgage Association | $48,600 | -- | |
| Thaddeus R Dye | $69,900 | -- | |
| -- | $25,900 | -- |
Source: Public Records
Mortgage History
| Date | Status | Borrower | Loan Amount |
|---|---|---|---|
| Open | Radford Tina M | $64,485 | |
| Previous Owner | Thaddeus R Dye | $66,400 |
Source: Public Records
Tax History Compared to Growth
Tax History
| Year | Tax Paid | Tax Assessment Tax Assessment Total Assessment is a certain percentage of the fair market value that is determined by local assessors to be the total taxable value of land and additions on the property. | Land | Improvement |
|---|---|---|---|---|
| 2024 | $2,584 | $57,580 | $16,450 | $41,130 |
| 2023 | $2,551 | $57,580 | $16,450 | $41,130 |
| 2022 | $1,714 | $33,050 | $6,340 | $26,710 |
| 2021 | $1,717 | $33,050 | $6,340 | $26,710 |
| 2020 | $1,719 | $33,050 | $6,340 | $26,710 |
| 2019 | $1,585 | $26,120 | $5,080 | $21,040 |
| 2018 | $1,577 | $26,120 | $5,080 | $21,040 |
| 2017 | $1,658 | $26,120 | $5,080 | $21,040 |
| 2016 | $1,732 | $26,150 | $4,410 | $21,740 |
| 2015 | $1,573 | $26,150 | $4,410 | $21,740 |
| 2014 | $1,576 | $26,150 | $4,410 | $21,740 |
| 2013 | $819 | $27,545 | $4,655 | $22,890 |
Source: Public Records
Map
Nearby Homes
- 2275 Cardston Ct
- 3365 Bruceton Ave
- 2425 Mason Village Ct Unit 2425
- 2252 Meridian Ct
- 3830 Charbonnett Ct Unit 6-A
- 2472 Nassau Dr Unit 37D
- 2509 Burgandy Ln Unit 46B
- 2503 Burgandy Ln Unit 46A
- 3811 Bay Village St
- 1836 Penfield Ct S
- 3054 Wadsworth Ct
- 3036 Wadsworth Ct
- 3038 Wadsworth Ct
- 1767 Alcoy Dr
- 3325 E Deshler Ave
- 0 Ravenswood Ct
- 1664 Barnett Rd
- 3246 E Deshler Ave
- 3059 Remington Ridge Rd
- 2971 Queensrowe Dr
- 2276 Cardston Dr
- 2288 Cardston Dr
- 2270 Cardston Dr
- 2294 Cardston Dr
- 3436 Cardston Place
- 2262 Cardston Dr
- 2273 Cardston Dr
- 3465 Courtright Ln
- 2302 Cardston Dr
- 3475 Courtright Ln
- 2267 Cardston Dr
- 3437 Cardston Place
- 2263 Cardston Dr
- 3466 Courtright Ln
- 2256 Cardston Dr
- 3462 Courtright Ln
- 2261 Cardston Dr
- 2308 Cardston Dr
- 3483 Courtright Ln
- 3429 Cardston Place