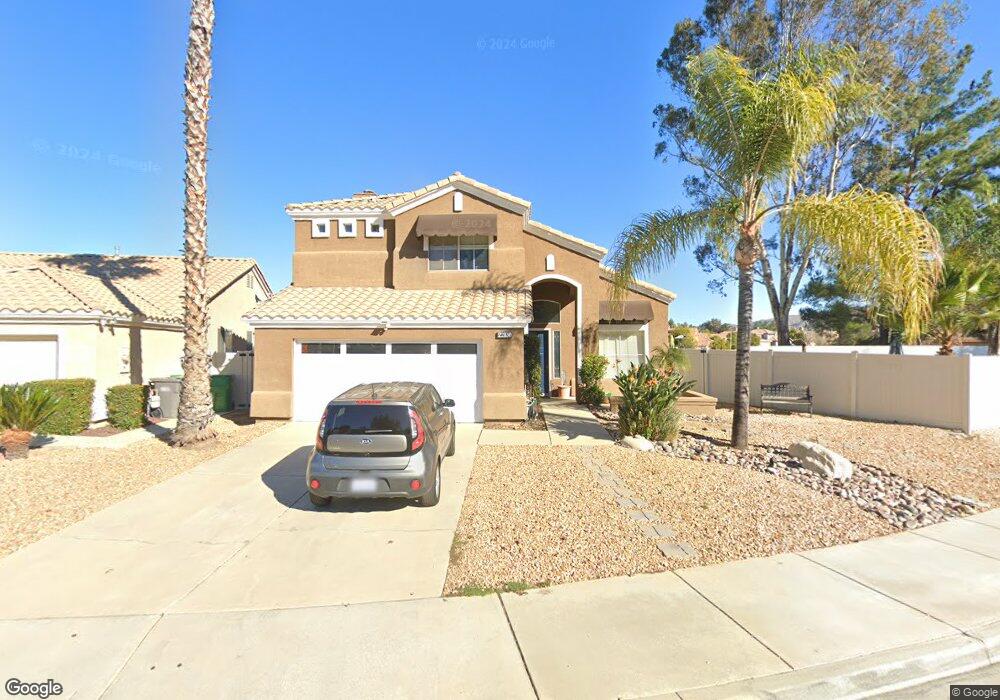
22850 Mountain Ash Cir Corona, CA 92883
Wildrose NeighborhoodEstimated Value: $691,000 - $748,000
3
Beds
3
Baths
1,733
Sq Ft
$417/Sq Ft
Est. Value
About This Home
This home is located at 22850 Mountain Ash Cir, Corona, CA 92883 and is currently estimated at $723,219, approximately $417 per square foot. 22850 Mountain Ash Cir is a home located in Riverside County with nearby schools including Temescal Valley Elementary School, El Cerrito Middle School, and Santiago High School.
Ownership History
Date
Name
Owned For
Owner Type
Purchase Details
Closed on
May 18, 2000
Sold by
Searles Scott and Searles Michelle
Bought by
Decker Jonathan F and Decker Kimberly G
Current Estimated Value
Home Financials for this Owner
Home Financials are based on the most recent Mortgage that was taken out on this home.
Original Mortgage
$200,850
Outstanding Balance
$72,034
Interest Rate
8.67%
Mortgage Type
VA
Estimated Equity
$651,185
Purchase Details
Closed on
Jan 19, 1996
Sold by
Udc Homes Inc
Bought by
Searles Scott and Searles Michelle
Home Financials for this Owner
Home Financials are based on the most recent Mortgage that was taken out on this home.
Original Mortgage
$152,993
Interest Rate
7.18%
Mortgage Type
FHA
Create a Home Valuation Report for This Property
The Home Valuation Report is an in-depth analysis detailing your home's value as well as a comparison with similar homes in the area
Home Values in the Area
Average Home Value in this Area
Purchase History
| Date | Buyer | Sale Price | Title Company |
|---|---|---|---|
| Decker Jonathan F | $195,000 | First Southwestern Title Co | |
| Searles Scott | $156,000 | Chicago Title |
Source: Public Records
Mortgage History
| Date | Status | Borrower | Loan Amount |
|---|---|---|---|
| Open | Decker Jonathan F | $200,850 | |
| Previous Owner | Searles Scott | $152,993 |
Source: Public Records
Tax History Compared to Growth
Tax History
| Year | Tax Paid | Tax Assessment Tax Assessment Total Assessment is a certain percentage of the fair market value that is determined by local assessors to be the total taxable value of land and additions on the property. | Land | Improvement |
|---|---|---|---|---|
| 2025 | $3,612 | $326,419 | $69,147 | $257,272 |
| 2023 | $3,612 | $313,746 | $66,463 | $247,283 |
| 2022 | $3,497 | $307,595 | $65,160 | $242,435 |
| 2021 | $3,427 | $301,565 | $63,883 | $237,682 |
| 2020 | $3,389 | $298,473 | $63,228 | $235,245 |
| 2019 | $3,311 | $292,622 | $61,989 | $230,633 |
| 2018 | $3,237 | $286,885 | $60,775 | $226,110 |
| 2017 | $2,904 | $258,222 | $59,584 | $198,638 |
| 2016 | $2,877 | $253,160 | $58,416 | $194,744 |
| 2015 | $2,815 | $249,360 | $57,540 | $191,820 |
| 2014 | $2,712 | $244,477 | $56,414 | $188,063 |
Source: Public Records
Map
Nearby Homes
- 22810 Mountain Ash Cir
- 22701 Hannah Ct
- 22801 Hannah Ct
- 9121 Gold Fields Cir
- 9510 Nickellaus Ct
- 9387 Hot Springs Rd
- 19980 Temescal Canyon Rd
- 8875 Soothing Ct
- 8851 Soothing Ct
- 8863 Crest View Dr
- 8824 Soothing Ct
- 8832 Gentle Wind Dr
- 22315 Hayworth Ct
- 8982 Dahlia Dr
- 8941 Carnation Dr
- 8550 Rolling Hills Dr
- 23375 Toronja Corte
- 8800 Camino Limon Rd
- 0 Retreat Pkwy
- 23649 Cantara Rd
- 22840 Mountain Ash Cir
- 22830 Mountain Ash Cir
- 22837 Mountain Ash Cir
- 9250 Nickellaus Ct
- 22820 Mountain Ash Cir
- 22857 Mountain Ash Cir
- 22827 Mountain Ash Cir
- 9249 Scotty Way
- 22867 Mountain Ash Cir
- 9255 Nickellaus Ct
- 22877 Mountain Ash Cir
- 22817 Mountain Ash Cir
- 9260 Nickellaus Ct
- 9259 Scotty Way
- 9265 Nickellaus Ct
- 22872 Rockcress St
- 9270 Nickellaus Ct
- 22807 Mountain Ash Cir
- 22882 Rockcress St
- 22862 Rockcress St