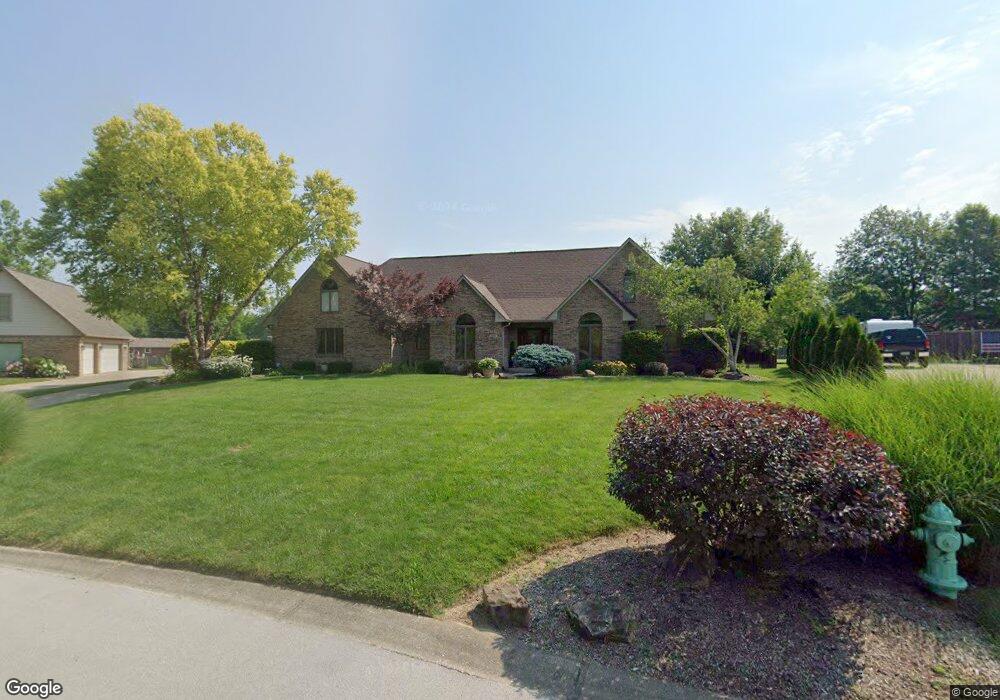
2287 Papaw Ct Plainfield, IN 46168
Estimated Value: $454,000 - $565,000
4
Beds
3
Baths
3,980
Sq Ft
$130/Sq Ft
Est. Value
About This Home
This home is located at 2287 Papaw Ct, Plainfield, IN 46168 and is currently estimated at $517,160, approximately $129 per square foot. 2287 Papaw Ct is a home located in Hendricks County with nearby schools including White Oak Elementary School, Cedar Elementary School, and Avon Intermediate School West.
Ownership History
Date
Name
Owned For
Owner Type
Purchase Details
Closed on
May 28, 2020
Sold by
Christie Robert M and Christie Lori A
Bought by
Susud Kent L and Susud Michelle R
Current Estimated Value
Home Financials for this Owner
Home Financials are based on the most recent Mortgage that was taken out on this home.
Original Mortgage
$250,000
Interest Rate
2.6%
Mortgage Type
New Conventional
Purchase Details
Closed on
Aug 18, 2017
Sold by
Rector Kevin G and Rector Pamela S
Bought by
Christie Robert M and Christie Lori A
Home Financials for this Owner
Home Financials are based on the most recent Mortgage that was taken out on this home.
Original Mortgage
$288,000
Interest Rate
3.96%
Mortgage Type
New Conventional
Purchase Details
Closed on
Apr 19, 2013
Sold by
Ashby Aaron and Ashby Jennifer
Bought by
Rector Kevin G and Rector Pamela S
Create a Home Valuation Report for This Property
The Home Valuation Report is an in-depth analysis detailing your home's value as well as a comparison with similar homes in the area
Home Values in the Area
Average Home Value in this Area
Purchase History
| Date | Buyer | Sale Price | Title Company |
|---|---|---|---|
| Susud Kent L | $425,000 | 1St American Title | |
| Christie Robert M | -- | First American Title | |
| Rector Kevin G | -- | -- |
Source: Public Records
Mortgage History
| Date | Status | Borrower | Loan Amount |
|---|---|---|---|
| Previous Owner | Susud Kent L | $250,000 | |
| Previous Owner | Christie Robert M | $288,000 |
Source: Public Records
Tax History
| Year | Tax Paid | Tax Assessment Tax Assessment Total Assessment is a certain percentage of the fair market value that is determined by local assessors to be the total taxable value of land and additions on the property. | Land | Improvement |
|---|---|---|---|---|
| 2025 | $5,254 | $474,600 | $74,200 | $400,400 |
| 2024 | $5,254 | $454,400 | $74,200 | $380,200 |
| 2023 | $4,984 | $422,800 | $67,400 | $355,400 |
| 2022 | $4,790 | $408,400 | $64,300 | $344,100 |
| 2021 | $4,499 | $379,800 | $64,300 | $315,500 |
| 2020 | $4,315 | $360,500 | $64,300 | $296,200 |
| 2019 | $4,527 | $355,900 | $61,700 | $294,200 |
| 2018 | $4,492 | $349,300 | $61,700 | $287,600 |
| 2017 | $3,471 | $316,000 | $53,500 | $262,500 |
| 2016 | $3,350 | $285,100 | $53,500 | $231,600 |
| 2014 | $3,153 | $264,700 | $48,900 | $215,800 |
Source: Public Records
Map
Nearby Homes
- 7370 Hidden Valley Dr
- 7686 Rolling Green Dr
- 7440 Oakview Dr
- 2659 Dorset Dr
- 2477 Burgundy Way
- 0 S Avon Ave Unit MBR22032323
- 7574 Williamsburg Dr
- 1914 S State Rd
- 7066 Halifax Ct
- 7707 Wheelwright Ct
- 6883 Roundrock Ct
- 6862 Trailside Dr
- 6831 Trailside Dr Unit Avon
- 6831 Trailside Dr
- 2048 Whitetail Ct
- 0 Woodside Dr
- 6678 Avalon Blvd
- 6640 Avalon Blvd
- 6589 Avalon Blvd
- 6686 Woodcrest Dr
- 2287 Papaw Ct
- 2322 Papaw Ct
- LOT146 Papaw Ct
- 2365 Papaw Ct
- 2309 Papaw Ct
- 2346 Papaw Ct
- 7346 Hawthorne Dr
- 7314 Hawthorne Dr
- 7385 Spruce Ct
- 7372 Hawthorne Dr
- 7380 Spruce Ct
- 7288 Hawthorne Dr
- 2278 Papaw Ct
- 7398 Hawthorne Dr
- 7341 Hawthorne Dr
- 7325 Hawthorne Dr
- 7405 Spruce Ct
- 7359 Hawthorne Dr
- 7388 Spruce Ct
- 7266 Hawthorne Dr
Your Personal Tour Guide
Ask me questions while you tour the home.