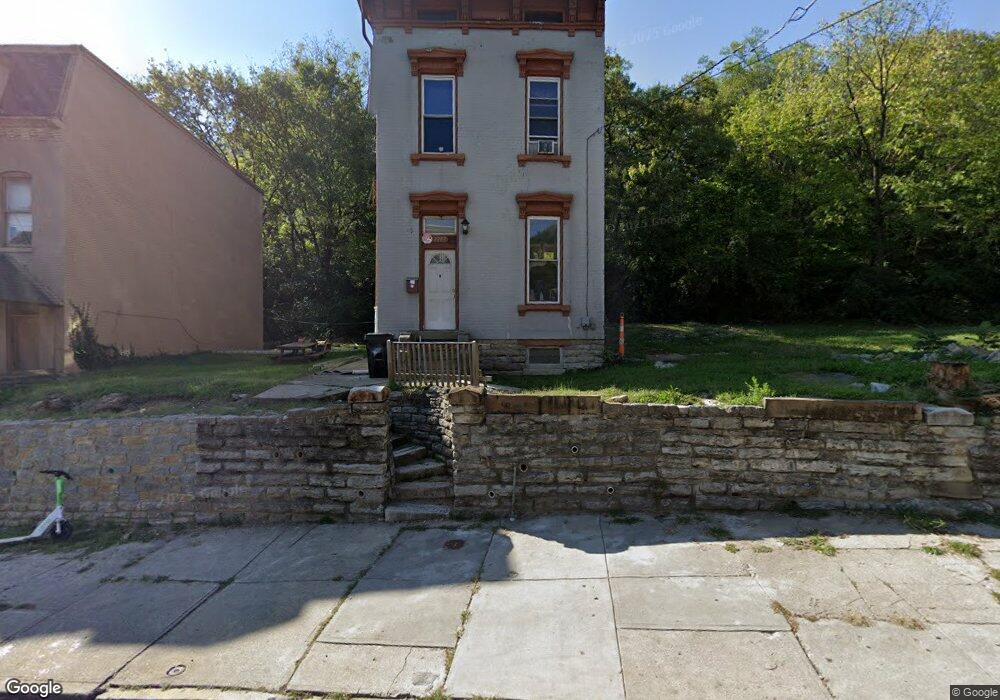
2287 Vine St Cincinnati, OH 45219
Clifton NeighborhoodEstimated Value: $338,000 - $413,000
4
Beds
2
Baths
2,921
Sq Ft
$129/Sq Ft
Est. Value
About This Home
This home is located at 2287 Vine St, Cincinnati, OH 45219 and is currently estimated at $375,979, approximately $128 per square foot. 2287 Vine St is a home located in Hamilton County with nearby schools including Clifton Area Neighborhood School, Robert A. Taft Information Technology High School, and Gilbert A. Dater High School.
Ownership History
Date
Name
Owned For
Owner Type
Purchase Details
Closed on
May 6, 2013
Sold by
Allen Greg G and Allen Greg G
Bought by
Pure Development Group Llc
Current Estimated Value
Purchase Details
Closed on
Sep 22, 2004
Sold by
Hancock Henry E and Hancock Barbara J
Bought by
Allen Greg G
Purchase Details
Closed on
May 25, 2000
Sold by
Altegra Credit Company
Bought by
Hancock Henry E and Hancock Barbara J
Purchase Details
Closed on
Feb 4, 2000
Sold by
Phelon Johnnie A
Bought by
Altegra Credit Company
Create a Home Valuation Report for This Property
The Home Valuation Report is an in-depth analysis detailing your home's value as well as a comparison with similar homes in the area
Home Values in the Area
Average Home Value in this Area
Purchase History
| Date | Buyer | Sale Price | Title Company |
|---|---|---|---|
| Pure Development Group Llc | -- | Attorney | |
| Allen Greg G | $10,000 | -- | |
| Hancock Henry E | $10,000 | -- | |
| Altegra Credit Company | $14,000 | -- |
Source: Public Records
Tax History
| Year | Tax Paid | Tax Assessment Tax Assessment Total Assessment is a certain percentage of the fair market value that is determined by local assessors to be the total taxable value of land and additions on the property. | Land | Improvement |
|---|---|---|---|---|
| 2025 | $6,003 | $94,511 | $19,688 | $74,823 |
| 2023 | $6,005 | $94,511 | $19,688 | $74,823 |
| 2022 | $4,781 | $67,634 | $7,483 | $60,151 |
| 2021 | $4,695 | $67,634 | $7,483 | $60,151 |
| 2020 | $4,709 | $67,634 | $7,483 | $60,151 |
| 2019 | $4,533 | $59,326 | $6,563 | $52,763 |
| 2018 | $4,536 | $59,326 | $6,563 | $52,763 |
| 2017 | $4,369 | $59,326 | $6,563 | $52,763 |
| 2016 | $1,453 | $19,166 | $6,314 | $12,852 |
| 2015 | $1,300 | $19,166 | $6,314 | $12,852 |
| 2014 | $1,307 | $19,166 | $6,314 | $12,852 |
| 2013 | $1,198 | $17,266 | $5,688 | $11,578 |
Source: Public Records
Map
Nearby Homes
Your Personal Tour Guide
Ask me questions while you tour the home.