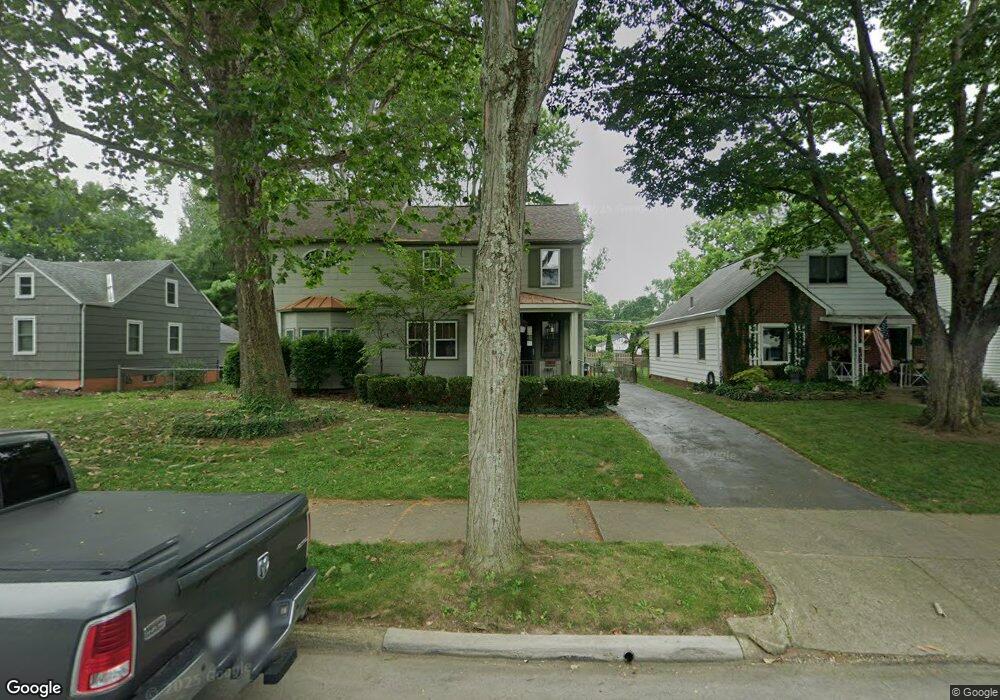
229 E Beechwold Blvd Columbus, OH 43214
Clintonville NeighborhoodEstimated Value: $519,000 - $720,000
5
Beds
3
Baths
2,520
Sq Ft
$232/Sq Ft
Est. Value
About This Home
This home is located at 229 E Beechwold Blvd, Columbus, OH 43214 and is currently estimated at $585,546, approximately $232 per square foot. 229 E Beechwold Blvd is a home located in Franklin County with nearby schools including Indian Springs Elementary School, Dominion Middle School, and Whetstone High School.
Ownership History
Date
Name
Owned For
Owner Type
Purchase Details
Closed on
Jul 28, 2015
Sold by
Givler Wanda J
Bought by
Givler Kevin R
Current Estimated Value
Purchase Details
Closed on
Sep 28, 2001
Sold by
Peterson Neal W and Peterson Janet L
Bought by
Givler Kevin R and Givler Wanda J
Home Financials for this Owner
Home Financials are based on the most recent Mortgage that was taken out on this home.
Original Mortgage
$166,250
Outstanding Balance
$59,760
Interest Rate
6.37%
Mortgage Type
Purchase Money Mortgage
Estimated Equity
$525,786
Purchase Details
Closed on
Jun 26, 1998
Sold by
Zimmerman Calvin I and Zimmerman Monica B
Bought by
Peterson Neal W and Peterson Janet L
Home Financials for this Owner
Home Financials are based on the most recent Mortgage that was taken out on this home.
Original Mortgage
$80,000
Interest Rate
8.25%
Create a Home Valuation Report for This Property
The Home Valuation Report is an in-depth analysis detailing your home's value as well as a comparison with similar homes in the area
Home Values in the Area
Average Home Value in this Area
Purchase History
| Date | Buyer | Sale Price | Title Company |
|---|---|---|---|
| Givler Kevin R | -- | Attorney | |
| Givler Kevin R | $175,000 | -- | |
| Peterson Neal W | $152,500 | -- |
Source: Public Records
Mortgage History
| Date | Status | Borrower | Loan Amount |
|---|---|---|---|
| Open | Givler Kevin R | $166,250 | |
| Closed | Peterson Neal W | $80,000 |
Source: Public Records
Tax History
| Year | Tax Paid | Tax Assessment Tax Assessment Total Assessment is a certain percentage of the fair market value that is determined by local assessors to be the total taxable value of land and additions on the property. | Land | Improvement |
|---|---|---|---|---|
| 2025 | $6,771 | $150,860 | $50,510 | $100,350 |
| 2024 | $6,771 | $150,860 | $50,510 | $100,350 |
| 2023 | $6,684 | $150,850 | $50,505 | $100,345 |
| 2022 | $7,145 | $137,770 | $45,120 | $92,650 |
| 2021 | $7,158 | $137,770 | $45,120 | $92,650 |
| 2020 | $7,167 | $137,770 | $45,120 | $92,650 |
| 2019 | $6,410 | $105,670 | $34,690 | $70,980 |
| 2018 | $5,713 | $105,670 | $34,690 | $70,980 |
| 2017 | $6,406 | $105,670 | $34,690 | $70,980 |
| 2016 | $5,539 | $83,620 | $24,680 | $58,940 |
| 2015 | $5,028 | $83,620 | $24,680 | $58,940 |
| 2014 | $5,041 | $83,620 | $24,680 | $58,940 |
| 2013 | $2,368 | $79,625 | $23,485 | $56,140 |
Source: Public Records
Map
Nearby Homes
- 144 Wetmore Rd
- 350 E Beechwold Blvd
- 103 E Jeffrey Place
- 53 E Beechwold Blvd
- 389 Wetmore Rd
- 4938 Fairway Ct Unit 4938-4944
- 62 W Rathbone Ave
- 5019 N High St Unit 82
- 243 E Schreyer Place
- 601 Morse Rd
- 122 W Rathbone Ave
- 4299 Colerain Ave
- 702 E Weisheimer Rd
- 4464 Zeller Rd
- 238 W Henderson Rd
- 4466 Olentangy Blvd
- 325 Starrett Ct
- 5200 Fenway Ct Unit B
- 827 Inwood Place
- 4374 Scenic Dr
- 225 E Beechwold Blvd
- 219 E Beechwold Blvd
- 247 E Beechwold Blvd
- 215 E Beechwold Blvd
- 251 E Beechwold Blvd
- 230 Wetmore Rd
- 209 E Beechwold Blvd
- 240 Wetmore Rd
- 230 E Beechwold Blvd
- 236 E Beechwold Blvd
- 257 E Beechwold Blvd
- 226 E Beechwold Blvd
- 242 E Beechwold Blvd
- 220 Wetmore Rd
- 220 E Beechwold Blvd
- 246 E Beechwold Blvd
- 205 E Beechwold Blvd
- 263 E Beechwold Blvd
- 252 Wetmore Rd
- 212 Wetmore Rd
Your Personal Tour Guide
Ask me questions while you tour the home.