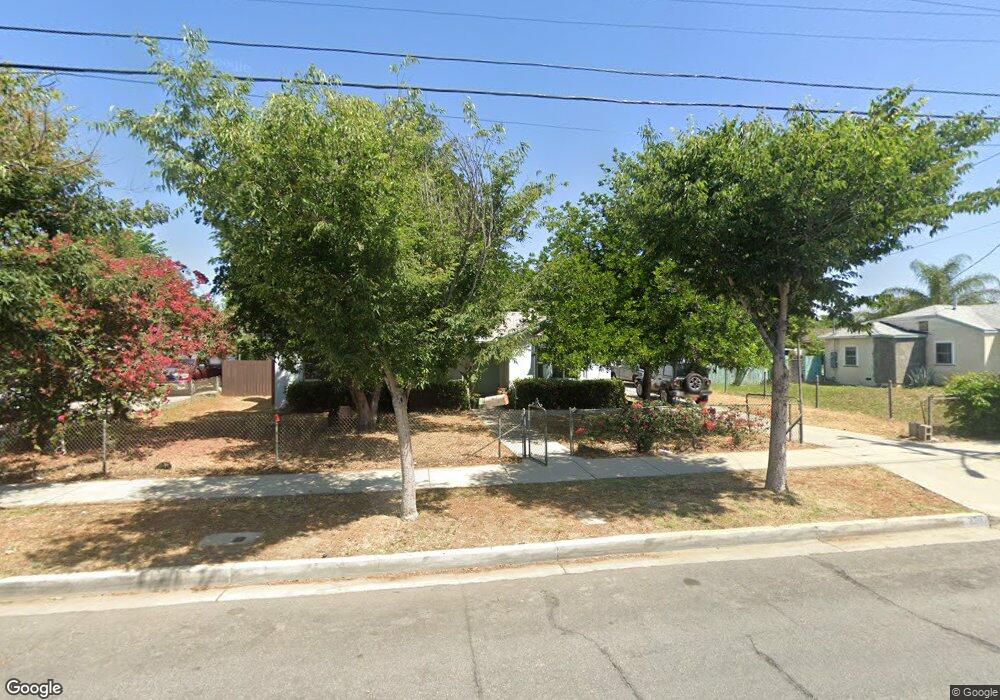
229 E Maple St Ontario, CA 91761
Downtown Ontario NeighborhoodEstimated Value: $538,000 - $683,777
3
Beds
2
Baths
1,443
Sq Ft
$417/Sq Ft
Est. Value
About This Home
This home is located at 229 E Maple St, Ontario, CA 91761 and is currently estimated at $602,444, approximately $417 per square foot. 229 E Maple St is a home located in San Bernardino County with nearby schools including Sultana Elementary School, De Anza Middle, and Ontario High School.
Ownership History
Date
Name
Owned For
Owner Type
Purchase Details
Closed on
Apr 22, 2009
Sold by
Citibank Na
Bought by
Sun Peter C K and Sun Dorothy J
Current Estimated Value
Purchase Details
Closed on
Oct 16, 2008
Sold by
Nalvarte Carlos
Bought by
Citibank Na
Purchase Details
Closed on
May 18, 2006
Sold by
Oconnor Virginia M
Bought by
Nalvarte Carlos
Home Financials for this Owner
Home Financials are based on the most recent Mortgage that was taken out on this home.
Original Mortgage
$320,000
Interest Rate
6.89%
Mortgage Type
Purchase Money Mortgage
Purchase Details
Closed on
Feb 11, 2005
Sold by
Oconnor Virginia M Ashlock
Bought by
Oconnor Virginia M
Home Financials for this Owner
Home Financials are based on the most recent Mortgage that was taken out on this home.
Original Mortgage
$169,600
Interest Rate
7.4%
Mortgage Type
New Conventional
Purchase Details
Closed on
Jul 19, 2000
Sold by
Ashlock Virginia M
Bought by
Oconnor Virginia M Ashlock
Home Financials for this Owner
Home Financials are based on the most recent Mortgage that was taken out on this home.
Original Mortgage
$121,200
Interest Rate
5.76%
Create a Home Valuation Report for This Property
The Home Valuation Report is an in-depth analysis detailing your home's value as well as a comparison with similar homes in the area
Home Values in the Area
Average Home Value in this Area
Purchase History
| Date | Buyer | Sale Price | Title Company |
|---|---|---|---|
| Sun Peter C K | $105,000 | Lsi Title Agency | |
| Citibank Na | $185,035 | American Title | |
| Nalvarte Carlos | $400,000 | Fidelity National Title Co | |
| Oconnor Virginia M | -- | United Independent Title | |
| Oconnor Virginia M Ashlock | -- | Orange Coast Title |
Source: Public Records
Mortgage History
| Date | Status | Borrower | Loan Amount |
|---|---|---|---|
| Previous Owner | Nalvarte Carlos | $320,000 | |
| Previous Owner | Oconnor Virginia M | $169,600 | |
| Previous Owner | Oconnor Virginia M Ashlock | $121,200 |
Source: Public Records
Tax History
| Year | Tax Paid | Tax Assessment Tax Assessment Total Assessment is a certain percentage of the fair market value that is determined by local assessors to be the total taxable value of land and additions on the property. | Land | Improvement |
|---|---|---|---|---|
| 2025 | $1,507 | $135,537 | $96,813 | $38,724 |
| 2024 | $1,473 | $132,880 | $94,915 | $37,965 |
| 2023 | $1,432 | $130,275 | $93,054 | $37,221 |
| 2022 | $1,413 | $127,720 | $91,229 | $36,491 |
| 2021 | $1,404 | $125,215 | $89,440 | $35,775 |
| 2020 | $1,380 | $123,931 | $88,523 | $35,408 |
| 2019 | $1,368 | $121,501 | $86,787 | $34,714 |
| 2018 | $1,349 | $119,118 | $85,085 | $34,033 |
| 2017 | $1,301 | $116,783 | $83,417 | $33,366 |
| 2016 | $1,250 | $114,493 | $81,781 | $32,712 |
| 2015 | $1,242 | $112,774 | $80,553 | $32,221 |
| 2014 | $1,203 | $110,565 | $78,975 | $31,590 |
Source: Public Records
Map
Nearby Homes
- 221 E Maple St
- 1606 S Laurel Ave
- 214 W Locust St
- 1650 S Campus Ave Unit 12
- 1502 S Pleasant Ave
- 304 E Cedar St
- 1420 S Euclid Ave
- 1343 S Sultana Ave
- 1214 S Sultana Ave
- 2021 S Campus Ave Unit 28F
- 2041 S Oakland Ave
- 310 E Philadelphia St Unit 147
- 310 E Philadelphia St Unit SPC 102
- 1546 Redwood Ave
- 2119 S Phoenix Place
- 840 E Cedar St
- 2333 S Via Esplanade Unit 29
- 2300 S Sultana Ave Unit 298
- 2300 S Sultana Ave Unit 286
- 2300 S Sultana Ave Unit 256
- 237 E Maple St
- 301 E Maple St
- 213 E Maple St
- 309 E Maple St
- 205 E Maple St
- 311 E Maple St
- 230 E Maple St
- 238 E Maple St
- 222 E Maple St
- 304 E Maple St
- 214 E Maple St
- 319 E Maple St
- 232 E Locust St
- 129 E Maple St
- 320 E Locust St
- 310 E Maple St
- 230 E Locust St
- 236 E Locust St
- 206 E Maple St
- 304 E Locust St
Your Personal Tour Guide
Ask me questions while you tour the home.