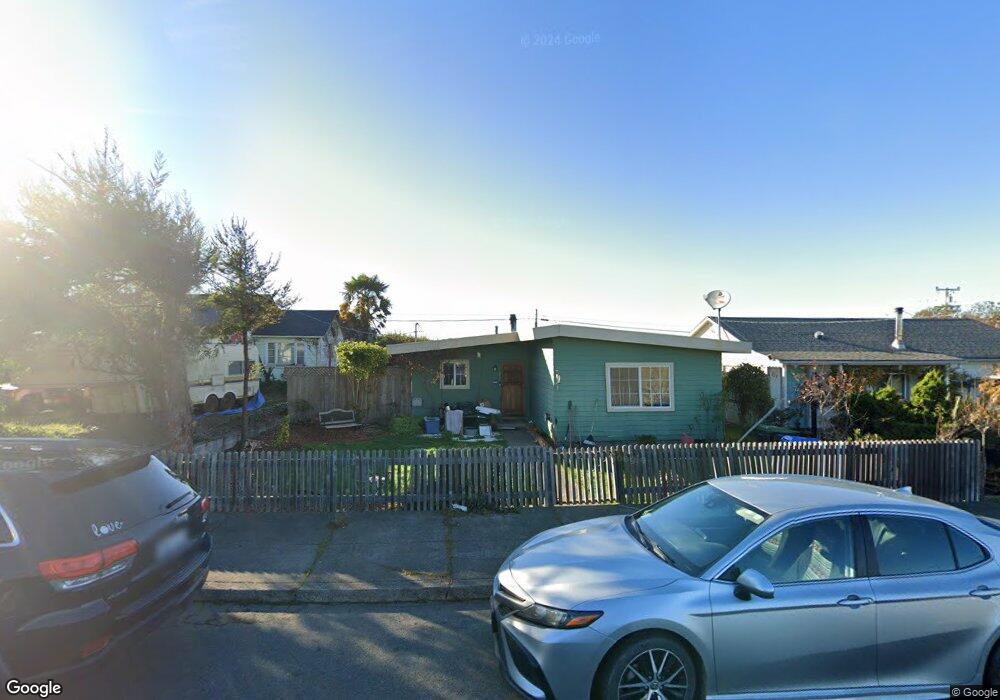
229 S Corry St Fort Bragg, CA 95437
Estimated Value: $440,610 - $541,000
--
Bed
--
Bath
--
Sq Ft
7,449
Sq Ft Lot
About This Home
This home is located at 229 S Corry St, Fort Bragg, CA 95437 and is currently estimated at $489,903. 229 S Corry St is a home located in Mendocino County with nearby schools including Fort Bragg High School.
Ownership History
Date
Name
Owned For
Owner Type
Purchase Details
Closed on
May 7, 2010
Sold by
Ciancio Michael A and Ciancio Natasha L
Bought by
Ciancio Michael A and Ciancio Natasha L
Current Estimated Value
Purchase Details
Closed on
May 13, 2005
Sold by
Ciancio Michael A and Valadao Natasha
Bought by
Ciancio Michael A and Ciancio Natasha
Home Financials for this Owner
Home Financials are based on the most recent Mortgage that was taken out on this home.
Original Mortgage
$245,000
Interest Rate
5.87%
Mortgage Type
Stand Alone Refi Refinance Of Original Loan
Purchase Details
Closed on
Jan 14, 2002
Sold by
Ciancio Michael A
Bought by
Ciancio Michael A and Valadao Natasha
Home Financials for this Owner
Home Financials are based on the most recent Mortgage that was taken out on this home.
Original Mortgage
$150,500
Interest Rate
6.84%
Mortgage Type
Purchase Money Mortgage
Create a Home Valuation Report for This Property
The Home Valuation Report is an in-depth analysis detailing your home's value as well as a comparison with similar homes in the area
Home Values in the Area
Average Home Value in this Area
Purchase History
| Date | Buyer | Sale Price | Title Company |
|---|---|---|---|
| Ciancio Michael A | -- | None Available | |
| Ciancio Michael A | -- | None Available | |
| Ciancio Michael A | -- | First American Title | |
| Ciancio Michael A | -- | First American Title |
Source: Public Records
Mortgage History
| Date | Status | Borrower | Loan Amount |
|---|---|---|---|
| Closed | Ciancio Michael A | $245,000 | |
| Closed | Ciancio Michael A | $150,500 |
Source: Public Records
Tax History Compared to Growth
Tax History
| Year | Tax Paid | Tax Assessment Tax Assessment Total Assessment is a certain percentage of the fair market value that is determined by local assessors to be the total taxable value of land and additions on the property. | Land | Improvement |
|---|---|---|---|---|
| 2025 | $3,169 | $274,611 | $104,006 | $170,605 |
| 2023 | $3,169 | $263,949 | $99,968 | $163,981 |
| 2022 | $3,150 | $258,774 | $98,008 | $160,766 |
| 2021 | $2,971 | $253,701 | $96,087 | $157,614 |
| 2020 | $2,909 | $251,026 | $95,067 | $155,959 |
| 2019 | $2,870 | $246,105 | $93,203 | $152,902 |
| 2018 | $2,832 | $241,281 | $91,376 | $149,905 |
| 2017 | $2,623 | $236,551 | $89,585 | $146,966 |
| 2016 | $2,570 | $231,914 | $87,829 | $144,085 |
| 2015 | $2,529 | $228,431 | $86,510 | $141,921 |
| 2014 | $2,463 | $223,956 | $84,815 | $139,141 |
Source: Public Records
Map
Nearby Homes
- 443 S Harrison St
- 142 S Franklin St
- 494 S Whipple St
- 251 S Franklin St
- 459 S Mcpherson St
- 575 S Whipple St
- 517 S Lincoln St
- 571 S Franklin St
- 423 N Franklin St
- 215 S Sanderson Way
- 119 E Pine St
- 545 N Mcpherson St
- 854 Woodward St
- 300 N Harbor Dr
- 715 West St
- 944 Stewart St
- 924 Glass Beach Dr
- 19351 Del Mar Dr
- 19701 Noyo Acres Dr
- 1184 N Main St Unit 1