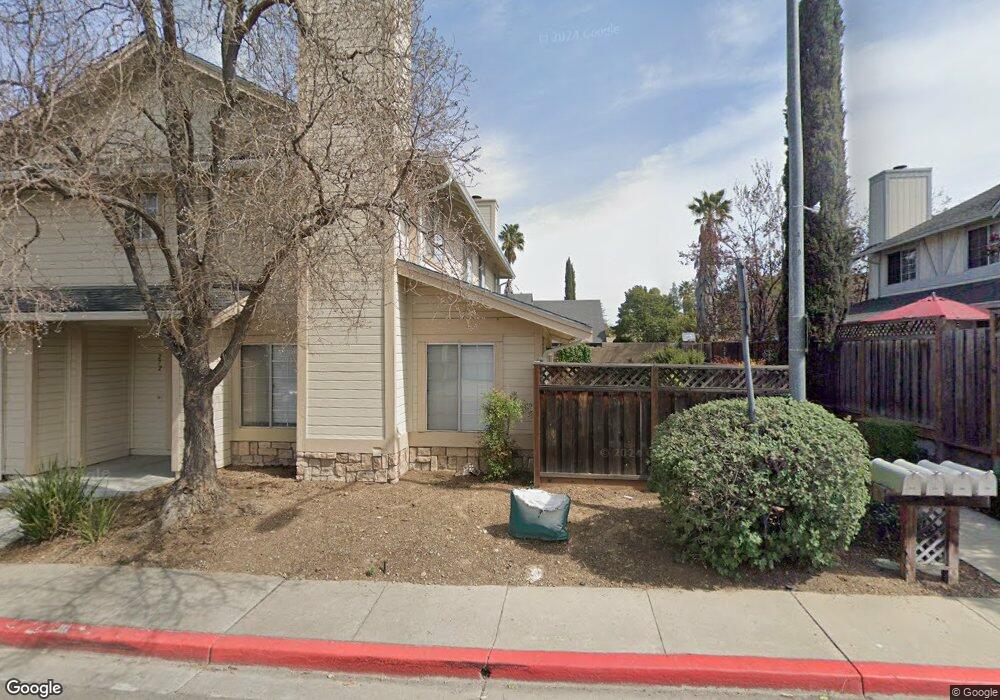
229 Wild Flower Ct Pleasanton, CA 94566
Estimated Value: $1,209,000 - $1,231,000
3
Beds
2
Baths
1,421
Sq Ft
$856/Sq Ft
Est. Value
About This Home
This home is located at 229 Wild Flower Ct, Pleasanton, CA 94566 and is currently estimated at $1,216,775, approximately $856 per square foot. 229 Wild Flower Ct is a home located in Alameda County with nearby schools including Valley View Elementary School, Pleasanton Middle School, and Amador Valley High School.
Ownership History
Date
Name
Owned For
Owner Type
Purchase Details
Closed on
Oct 2, 2017
Sold by
Kwon Ojin and Cho Sunju
Bought by
Hemaraju Shabaresha and Nagaraj Gomathi
Current Estimated Value
Home Financials for this Owner
Home Financials are based on the most recent Mortgage that was taken out on this home.
Original Mortgage
$89,000
Outstanding Balance
$74,420
Interest Rate
3.86%
Mortgage Type
Stand Alone Second
Estimated Equity
$1,142,355
Purchase Details
Closed on
Aug 7, 2013
Sold by
Vande Roovaart John and Vande Van De
Bought by
Kwon Ojin and Cho Sunju
Home Financials for this Owner
Home Financials are based on the most recent Mortgage that was taken out on this home.
Original Mortgage
$330,000
Interest Rate
3.75%
Mortgage Type
Adjustable Rate Mortgage/ARM
Create a Home Valuation Report for This Property
The Home Valuation Report is an in-depth analysis detailing your home's value as well as a comparison with similar homes in the area
Home Values in the Area
Average Home Value in this Area
Purchase History
| Date | Buyer | Sale Price | Title Company |
|---|---|---|---|
| Hemaraju Shabaresha | $890,000 | Orange Coast Title Co Norcal | |
| Kwon Ojin | $605,000 | Old Republic Title Company |
Source: Public Records
Mortgage History
| Date | Status | Borrower | Loan Amount |
|---|---|---|---|
| Open | Hemaraju Shabaresha | $89,000 | |
| Previous Owner | Kwon Ojin | $330,000 |
Source: Public Records
Tax History Compared to Growth
Tax History
| Year | Tax Paid | Tax Assessment Tax Assessment Total Assessment is a certain percentage of the fair market value that is determined by local assessors to be the total taxable value of land and additions on the property. | Land | Improvement |
|---|---|---|---|---|
| 2025 | $11,703 | $1,012,650 | $512,014 | $500,636 |
| 2024 | $11,703 | $992,795 | $501,975 | $490,820 |
| 2023 | $11,569 | $973,330 | $492,133 | $481,197 |
| 2022 | $10,961 | $954,248 | $482,485 | $471,763 |
| 2021 | $10,680 | $935,540 | $473,026 | $462,514 |
| 2020 | $10,544 | $925,956 | $468,180 | $457,776 |
| 2019 | $10,673 | $907,800 | $459,000 | $448,800 |
| 2018 | $10,458 | $890,000 | $450,000 | $440,000 |
| 2017 | $7,486 | $639,024 | $191,707 | $447,317 |
| 2016 | $6,911 | $626,494 | $187,948 | $438,546 |
| 2015 | $6,783 | $617,087 | $185,126 | $431,961 |
| 2014 | $6,904 | $605,000 | $181,500 | $423,500 |
Source: Public Records
Map
Nearby Homes
- 373 Linden Way
- 215 Mavis Dr
- 3845 Vineyard Ave Unit F
- 3841 Vineyard Ave Unit 18
- 3839 Vineyard Ave Unit F
- 543 Tawny Dr
- 601 Palomino Dr Unit C
- 262 Birch Creek Dr
- 665 Palomino Dr Unit D
- 3937 Vine St
- 3375 Norton Way Unit 5
- 236 Birch Creek Terrace Unit 14
- 3399 Norton Way Unit 6
- 526 Malbec Ct
- 3263 Vineyard Ave Unit 44
- 3263 Vineyard Ave Unit 68
- 3263 Vineyard Ave Unit 174
- 3263 Vineyard Ave Unit 125
- 3263 Vineyard Ave Unit 132
- 3263 Vineyard Ave
- 217 Wild Flower Ct
- 276 Mavis Dr
- 241 Wild Flower Ct
- 3644 Vine St
- 272 Mavis Dr
- 205 Wild Flower Ct
- 284 Mavis Dr
- 3662 Vine St
- 3731 Vineyard Ave
- 3680 Vine St
- 3626 Vine St
- 3745 Vineyard Ave
- 3747 Vineyard Ave
- 3749 Vineyard Ave
- 277 Mavis Dr
- 269 Mavis Dr
- 3751 Vineyard Ave
- 3608 Vine St
- 193 Wild Flower Ln
- 261 Mavis Dr