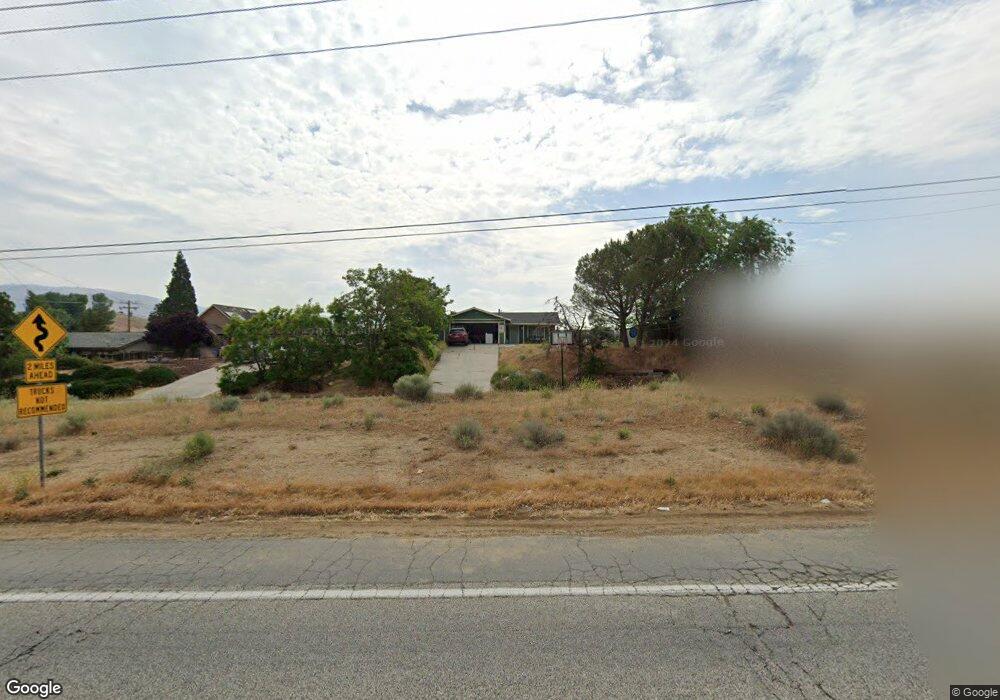
22900 Woodford-Tehachapi Rd Tehachapi, CA 93561
Estimated Value: $302,000 - $351,000
3
Beds
2
Baths
1,198
Sq Ft
$269/Sq Ft
Est. Value
About This Home
This home is located at 22900 Woodford-Tehachapi Rd, Tehachapi, CA 93561 and is currently estimated at $321,954, approximately $268 per square foot. 22900 Woodford-Tehachapi Rd is a home located in Kern County with nearby schools including Golden Hills Elementary School, Jacobsen Middle School, and Tehachapi High School.
Ownership History
Date
Name
Owned For
Owner Type
Purchase Details
Closed on
Aug 12, 2021
Sold by
Garcia Fanny Cecibell
Bought by
Freed Joseph
Current Estimated Value
Purchase Details
Closed on
Aug 6, 2021
Sold by
Almaraz Abel and Almaraz Carina Monique
Bought by
Freed Joseph
Purchase Details
Closed on
Mar 17, 2016
Sold by
Hart Dennis M and Hart Diana J
Bought by
Almaraz Abel and Almaraz Carina Monique
Home Financials for this Owner
Home Financials are based on the most recent Mortgage that was taken out on this home.
Original Mortgage
$172,750
Interest Rate
3.73%
Mortgage Type
New Conventional
Purchase Details
Closed on
Dec 9, 2013
Sold by
Gray John and Gray Patricia
Bought by
Hart Dennis M and Hart Diana J
Purchase Details
Closed on
May 7, 2012
Sold by
Wachovia Bank N A
Bought by
Gray John and Gray Patricia
Purchase Details
Closed on
Aug 1, 2011
Sold by
Cabrera Pedro E and Padilla Lina
Bought by
Wachovia Bank N A
Purchase Details
Closed on
Oct 15, 2004
Sold by
Bendlin Michael W and Bendlin Angela M
Bought by
Cabrera Pedro E and Padilla Lina
Home Financials for this Owner
Home Financials are based on the most recent Mortgage that was taken out on this home.
Original Mortgage
$150,400
Interest Rate
5.62%
Mortgage Type
Purchase Money Mortgage
Purchase Details
Closed on
Feb 23, 2001
Sold by
Ferrell Stanley and Ferrell Linda
Bought by
Bendlin Michael W and Bendlin Angela M
Home Financials for this Owner
Home Financials are based on the most recent Mortgage that was taken out on this home.
Original Mortgage
$74,335
Interest Rate
7.12%
Mortgage Type
FHA
Purchase Details
Closed on
Jan 21, 2000
Sold by
Hud
Bought by
Ferrell Stanley and Ferrell Linda
Home Financials for this Owner
Home Financials are based on the most recent Mortgage that was taken out on this home.
Original Mortgage
$39,980
Interest Rate
7.87%
Purchase Details
Closed on
Aug 6, 1999
Sold by
Market Street Mtg Corp
Bought by
Hud
Purchase Details
Closed on
Jan 26, 1999
Sold by
Mayfield Mamie Lee
Bought by
Market Street Mtg Corp
Purchase Details
Closed on
Sep 18, 1997
Sold by
Mayfield Mamie Lee and Mayfield Connie
Bought by
Beaugard Connie Mayfield and Beaugard Larry
Purchase Details
Closed on
Jul 21, 1997
Sold by
Mayfield Mamie Lee and Mayfield Connie
Bought by
Beaugard Larry
Purchase Details
Closed on
May 20, 1997
Sold by
Mayfield Mamie Lee
Bought by
Market Street Mtg Corp
Create a Home Valuation Report for This Property
The Home Valuation Report is an in-depth analysis detailing your home's value as well as a comparison with similar homes in the area
Home Values in the Area
Average Home Value in this Area
Purchase History
We collect this data history from publicly available records. To have your information removed, we recommend requesting removal directly through your county’s website.
| Date | Buyer | Sale Price | Title Company |
|---|---|---|---|
| Freed Joseph | -- | Chicago Title Company | |
| Freed Joseph | $235,000 | Chicago Title Company | |
| Almaraz Abel | $168,000 | First American Title Company | |
| Hart Dennis M | $120,000 | Chicago Title Company | |
| Gray John | $66,500 | North American Title | |
| Wachovia Bank N A | $91,350 | Landsafe Title | |
| Cabrera Pedro E | $188,000 | Chicago Title | |
| Bendlin Michael W | $75,000 | Commonwealth Land Title Co | |
| Ferrell Stanley | $50,000 | Commonwealth Land Title Ins | |
| Hud | -- | Fidelity National Title Ins | |
| Market Street Mtg Corp | $89,284 | Fidelity National Title Ins | |
| Beaugard Connie Mayfield | -- | -- | |
| Beaugard Larry | -- | -- | |
| Market Street Mtg Corp | $76,221 | Fidelity National Title Ins |
Source: Public Records
Mortgage History
We collect this data history from publicly available records. To have your information removed, we recommend requesting removal directly through your county’s website.
| Date | Status | Borrower | Loan Amount |
|---|---|---|---|
| Previous Owner | Almaraz Abel | $172,750 | |
| Previous Owner | Cabrera Pedro E | $150,400 | |
| Previous Owner | Bendlin Michael W | $74,335 | |
| Previous Owner | Ferrell Stanley | $39,980 | |
| Closed | Cabrera Pedro E | $37,600 |
Source: Public Records
Tax History
| Year | Tax Paid | Tax Assessment Tax Assessment Total Assessment is a certain percentage of the fair market value that is determined by local assessors to be the total taxable value of land and additions on the property. | Land | Improvement |
|---|---|---|---|---|
| 2025 | $3,659 | $249,383 | $58,366 | $191,017 |
| 2024 | $3,543 | $244,494 | $57,222 | $187,272 |
| 2023 | $3,543 | $239,700 | $56,100 | $183,600 |
| 2022 | $3,500 | $235,000 | $55,000 | $180,000 |
| 2021 | $2,835 | $183,729 | $38,276 | $145,453 |
| 2020 | $2,862 | $181,846 | $37,884 | $143,962 |
| 2019 | $2,873 | $181,846 | $37,884 | $143,962 |
| 2018 | $2,783 | $174,787 | $36,414 | $138,373 |
| 2017 | $2,795 | $171,360 | $35,700 | $135,660 |
| 2016 | $1,613 | $124,263 | $24,852 | $99,411 |
| 2015 | $1,537 | $122,397 | $24,479 | $97,918 |
| 2014 | $1,520 | $120,000 | $24,000 | $96,000 |
Source: Public Records
Map
Nearby Homes
- 20220 Bald Mountain Dr
- 10125 Sears Dr
- 20109 Weston Ave
- 22712 Debbie Place
- 20012 Bald Mountain Dr
- 20601 Ridgecrest Dr
- 20022 Bald Mountain Dr
- 22630 Putting Green Way
- 219 Lot Lupine Ave
- 20037 Brite Valley Rd
- 20824 Brentwood Dr
- 21001 Carriage Dr
- 22351 Fontana St
- 0 Sycamore Dr Unit 9987149
- 0 Sycamore Dr Unit 23002990
- 0 Sycamore Dr Unit 240030
- 0 Sycamore Dr Unit 202303399
- 0 Sage Ave
- 21020 White Pine Dr
- 20924 Brentwood Dr
- 20412 Weston Ave
- 20416 Weston Ave
- 20404 Weston Ave
- 20408 Weston Ave
- 22904 Woodford Tehachapi Rd
- 22908 Woodford Tehachapi Rd
- 22900 Woodford Tehachapi Rd
- 20409 Weston Ave
- 20413 Weston Ave
- 20324 Weston Ave
- 20417 Weston Ave
- 20401 Weston Ave
- 22808 Woodford Tehachapi Rd
- 20425 Weston Ave
- 20405 Weston Ave
- 20320 Weston Ave
- 20429 Weston Ave
- 20325 Sears Dr
- 20321 Weston Ave
- 20316 Weston Ave
Your Personal Tour Guide
Ask me questions while you tour the home.