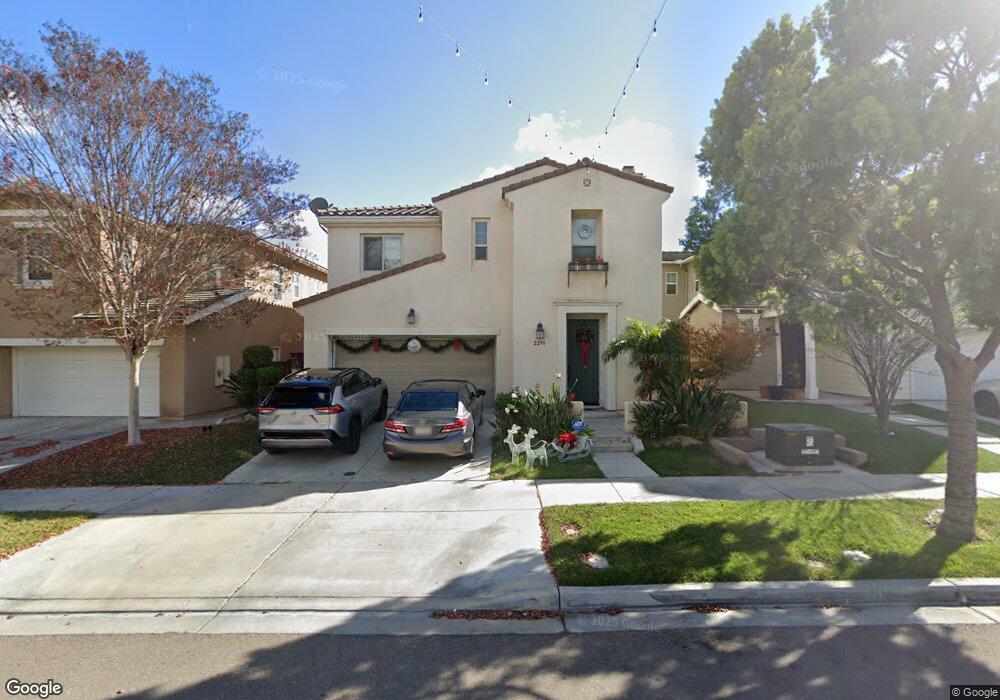
2296 Wander St Chula Vista, CA 91915
Otay Ranch NeighborhoodEstimated Value: $936,455 - $1,088,000
4
Beds
3
Baths
2,435
Sq Ft
$428/Sq Ft
Est. Value
About This Home
This home is located at 2296 Wander St, Chula Vista, CA 91915 and is currently estimated at $1,042,614, approximately $428 per square foot. 2296 Wander St is a home located in San Diego County with nearby schools including Camarena (Enrique S.) Elementary, Eastlake Middle School, and Olympian High School.
Ownership History
Date
Name
Owned For
Owner Type
Purchase Details
Closed on
Nov 17, 2008
Sold by
Marshall William M and Marshall Sonia M
Bought by
Barcega Ador and Barcega Lea
Current Estimated Value
Home Financials for this Owner
Home Financials are based on the most recent Mortgage that was taken out on this home.
Original Mortgage
$373,500
Outstanding Balance
$249,852
Interest Rate
6.47%
Mortgage Type
Purchase Money Mortgage
Estimated Equity
$792,762
Purchase Details
Closed on
Sep 25, 2006
Sold by
Brookfield Otay R15/16 Llc
Bought by
Marshall William M and Marshall Sonia M
Home Financials for this Owner
Home Financials are based on the most recent Mortgage that was taken out on this home.
Original Mortgage
$496,359
Interest Rate
5.75%
Mortgage Type
New Conventional
Create a Home Valuation Report for This Property
The Home Valuation Report is an in-depth analysis detailing your home's value as well as a comparison with similar homes in the area
Home Values in the Area
Average Home Value in this Area
Purchase History
| Date | Buyer | Sale Price | Title Company |
|---|---|---|---|
| Barcega Ador | $415,000 | Ticor Title | |
| Marshall William M | $620,500 | Chicago Title Co |
Source: Public Records
Mortgage History
| Date | Status | Borrower | Loan Amount |
|---|---|---|---|
| Open | Barcega Ador | $373,500 | |
| Previous Owner | Marshall William M | $124,090 | |
| Previous Owner | Marshall William M | $496,359 |
Source: Public Records
Tax History
| Year | Tax Paid | Tax Assessment Tax Assessment Total Assessment is a certain percentage of the fair market value that is determined by local assessors to be the total taxable value of land and additions on the property. | Land | Improvement |
|---|---|---|---|---|
| 2025 | $8,349 | $534,400 | $231,787 | $302,613 |
| 2024 | $8,349 | $523,923 | $227,243 | $296,680 |
| 2023 | $8,455 | $513,651 | $222,788 | $290,863 |
| 2022 | $8,346 | $503,580 | $218,420 | $285,160 |
| 2021 | $8,273 | $493,707 | $214,138 | $279,569 |
| 2020 | $8,149 | $488,646 | $211,943 | $276,703 |
| 2019 | $7,994 | $479,066 | $207,788 | $271,278 |
| 2018 | $7,897 | $469,673 | $203,714 | $265,959 |
| 2017 | $7,784 | $460,465 | $199,720 | $260,745 |
| 2016 | $7,557 | $451,437 | $195,804 | $255,633 |
| 2015 | $7,403 | $444,657 | $192,863 | $251,794 |
| 2014 | $8,828 | $435,948 | $189,086 | $246,862 |
Source: Public Records
Map
Nearby Homes
- 2301 Wander St
- 2205 Andalusia Ln
- 2233 Capistrano Way Unit 18
- 1817 Casa Torre Way
- 1924 Crossroads St
- 1811 Crossroads St
- 1733 Cripple Creek Dr Unit 4
- 1711 Summer Sky St
- 2170 Birch Rd Unit 111
- 2284 Red Leaf Ln
- 2080 Tango Loop Unit 1
- 2035 Element Way
- 2343 Arbor View St
- 2049 Bravo Loop Unit 5
- 2049 Bravo Loop Unit 6
- 3001 Bravo Loop Unit 2
- 1980 Affinity Ln
- 1812 Lynx Terrace
- 2056 Callisto Terrace
- 1595 Quiet Trail Dr
- 2292 Wander St
- 2300 Wander St
- 2288 Wander St
- 2304 Wander St
- 2291 Trellis St
- 2287 Trellis St
- 2295 Trellis St
- 2283 Trellis St
- 2308 Wander St
- 2284 Wander St
- 2299 Trellis St
- 2279 Trellis St
- 2297 Wander St
- 2293 Wander St
- 2303 Trellis St
- 2312 Wander St
- 2305 Wander St
- 2280 Wander St
- 2289 Wander St
- 2275 Trellis St
Your Personal Tour Guide
Ask me questions while you tour the home.