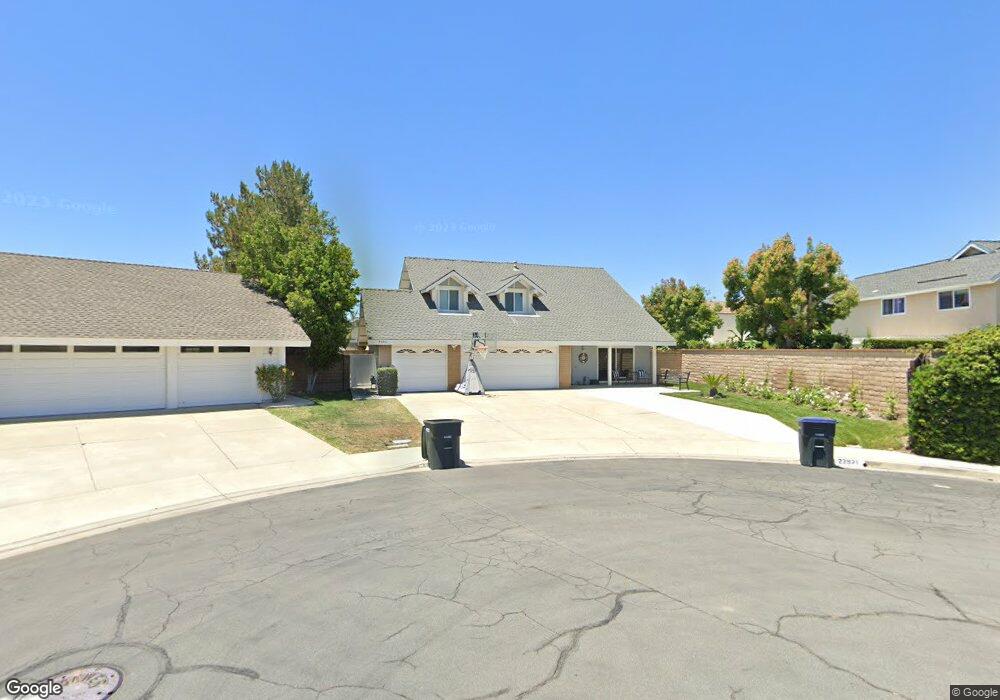
22971 Cedar Point Cir Lake Forest, CA 92630
Estimated Value: $1,288,000 - $1,420,000
4
Beds
3
Baths
1,904
Sq Ft
$699/Sq Ft
Est. Value
About This Home
This home is located at 22971 Cedar Point Cir, Lake Forest, CA 92630 and is currently estimated at $1,330,548, approximately $698 per square foot. 22971 Cedar Point Cir is a home located in Orange County with nearby schools including Olivewood Elementary School, Serrano Intermediate School, and El Toro High School.
Ownership History
Date
Name
Owned For
Owner Type
Purchase Details
Closed on
Mar 7, 2020
Sold by
Monroe Maria P
Bought by
Arbe Fernando Enrique and Monroe Maria P
Current Estimated Value
Purchase Details
Closed on
Jul 6, 2004
Sold by
Shapero Charles D and Shapero Wendy M
Bought by
Monroe Maria P
Home Financials for this Owner
Home Financials are based on the most recent Mortgage that was taken out on this home.
Original Mortgage
$450,000
Outstanding Balance
$180,243
Interest Rate
3.25%
Mortgage Type
New Conventional
Estimated Equity
$1,150,305
Purchase Details
Closed on
Jun 10, 2002
Sold by
Malcolm Douglas M and Malcolm Glynis
Bought by
Shapero Charles D and Shapero Wendy M
Home Financials for this Owner
Home Financials are based on the most recent Mortgage that was taken out on this home.
Original Mortgage
$334,400
Interest Rate
3.87%
Purchase Details
Closed on
Jul 9, 1997
Sold by
Downs Sharon D
Bought by
Malcolm Douglas M
Create a Home Valuation Report for This Property
The Home Valuation Report is an in-depth analysis detailing your home's value as well as a comparison with similar homes in the area
Home Values in the Area
Average Home Value in this Area
Purchase History
| Date | Buyer | Sale Price | Title Company |
|---|---|---|---|
| Arbe Fernando Enrique | -- | None Available | |
| Monroe Maria P | $650,000 | Ticor Title | |
| Shapero Charles D | $418,000 | Lawyers Title Company | |
| Malcolm Douglas M | -- | -- |
Source: Public Records
Mortgage History
| Date | Status | Borrower | Loan Amount |
|---|---|---|---|
| Open | Monroe Maria P | $450,000 | |
| Previous Owner | Shapero Charles D | $334,400 |
Source: Public Records
Tax History Compared to Growth
Tax History
| Year | Tax Paid | Tax Assessment Tax Assessment Total Assessment is a certain percentage of the fair market value that is determined by local assessors to be the total taxable value of land and additions on the property. | Land | Improvement |
|---|---|---|---|---|
| 2025 | $9,281 | $906,037 | $726,968 | $179,069 |
| 2024 | $9,281 | $888,272 | $712,714 | $175,558 |
| 2023 | $9,061 | $870,855 | $698,739 | $172,116 |
| 2022 | $8,898 | $853,780 | $685,038 | $168,742 |
| 2021 | $8,720 | $837,040 | $671,606 | $165,434 |
| 2020 | $7,818 | $749,700 | $613,365 | $136,335 |
| 2019 | $7,661 | $735,000 | $601,338 | $133,662 |
| 2018 | $7,667 | $735,000 | $601,338 | $133,662 |
| 2017 | $7,264 | $697,000 | $563,338 | $133,662 |
| 2016 | $6,672 | $639,000 | $505,338 | $133,662 |
| 2015 | $6,692 | $639,000 | $505,338 | $133,662 |
| 2014 | $5,963 | $571,507 | $437,845 | $133,662 |
Source: Public Records
Map
Nearby Homes
- 24210 Jasper Lake Ln Unit 52
- 23907 Barton St
- 23981 Crescent Rd
- 22682 S Canada Ct
- 22661 Pine Lake Ln
- 22627 Lakeside Ln
- 23952 Sutton Dr
- 23976 Carmel Dr
- 23972 Carmel Dr
- 22576 Lake Forest Ln
- 22875 Ridge Route Ln
- 22482 Lake Forest Ln
- 24481 Jutewood Place
- 24532 Corta Cresta Dr
- 24001 Muirlands Blvd Unit 221
- 24001 Muirlands Blvd Unit 185
- 24001 Muirlands Blvd Unit 329
- 24001 Muirlands Blvd Unit 347
- 24001 Muirlands Blvd Unit 115
- 24001 Muirlands Blvd Unit 34
- 24132 Jagger St
- 22981 Cedar Point Cir
- 24122 Jagger St
- 22922 Plainview Cir
- 22912 Plainview Cir
- 24136 Jagger St
- 22902 Plainview Cir
- 22932 Plainview Cir
- 22982 Cedar Point Cir
- 22892 Plainview Cir
- 22972 Cedar Point Cir
- 22962 Cedar Point Cir
- 22952 Cedar Point Cir
- 24131 Jagger St
- 24125 Jagger St
- 22961 Council Bluffs Ave
- 24121 Jagger St
- 22911 Plainview Cir
- 24141 Jagger St
- 22921 Plainview Cir