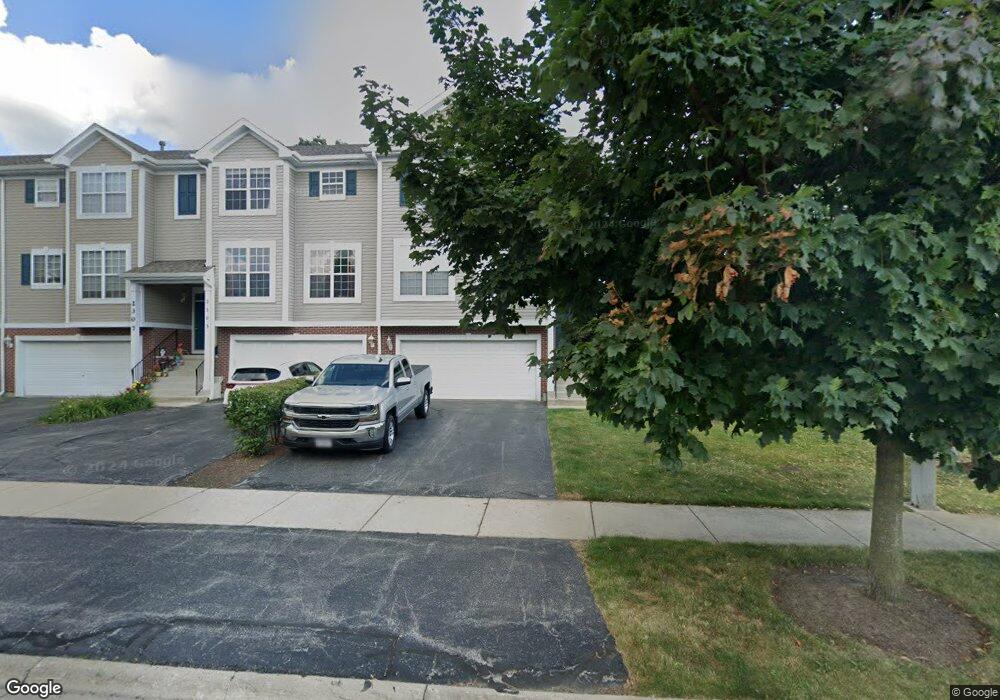
2299 Hudson Cir Unit 2804 Aurora, IL 60502
Eola Yards NeighborhoodEstimated Value: $334,827 - $357,000
3
Beds
3
Baths
1,588
Sq Ft
$216/Sq Ft
Est. Value
About This Home
This home is located at 2299 Hudson Cir Unit 2804, Aurora, IL 60502 and is currently estimated at $342,957, approximately $215 per square foot. 2299 Hudson Cir Unit 2804 is a home located in DuPage County with nearby schools including Nancy Young Elementary School, Francis Granger Middle School, and Metea Valley High School.
Ownership History
Date
Name
Owned For
Owner Type
Purchase Details
Closed on
Aug 27, 2009
Sold by
Carlentine Francyne
Bought by
Thiel Justin and Chavez Lorena
Current Estimated Value
Home Financials for this Owner
Home Financials are based on the most recent Mortgage that was taken out on this home.
Original Mortgage
$169,312
Outstanding Balance
$111,179
Interest Rate
5.27%
Mortgage Type
FHA
Estimated Equity
$231,778
Purchase Details
Closed on
Nov 26, 2003
Sold by
Wiseman Hughes Enterprises Inc
Bought by
Carlentine Francyne E
Home Financials for this Owner
Home Financials are based on the most recent Mortgage that was taken out on this home.
Original Mortgage
$159,440
Interest Rate
6.01%
Mortgage Type
Purchase Money Mortgage
Create a Home Valuation Report for This Property
The Home Valuation Report is an in-depth analysis detailing your home's value as well as a comparison with similar homes in the area
Home Values in the Area
Average Home Value in this Area
Purchase History
| Date | Buyer | Sale Price | Title Company |
|---|---|---|---|
| Thiel Justin | $208,000 | First American Title | |
| Carlentine Francyne E | $199,500 | Multiple |
Source: Public Records
Mortgage History
| Date | Status | Borrower | Loan Amount |
|---|---|---|---|
| Open | Thiel Justin | $169,312 | |
| Previous Owner | Carlentine Francyne E | $159,440 |
Source: Public Records
Tax History
| Year | Tax Paid | Tax Assessment Tax Assessment Total Assessment is a certain percentage of the fair market value that is determined by local assessors to be the total taxable value of land and additions on the property. | Land | Improvement |
|---|---|---|---|---|
| 2024 | $6,607 | $94,897 | $20,210 | $74,687 |
| 2023 | $6,280 | $85,270 | $18,160 | $67,110 |
| 2022 | $5,812 | $75,310 | $16,040 | $59,270 |
| 2021 | $5,652 | $72,620 | $15,470 | $57,150 |
| 2020 | $5,721 | $72,620 | $15,470 | $57,150 |
| 2019 | $5,510 | $69,070 | $14,710 | $54,360 |
| 2018 | $5,213 | $65,020 | $13,850 | $51,170 |
| 2017 | $5,119 | $62,810 | $13,380 | $49,430 |
| 2016 | $5,019 | $60,280 | $12,840 | $47,440 |
| 2015 | $4,955 | $57,230 | $12,190 | $45,040 |
| 2014 | $4,871 | $54,890 | $11,690 | $43,200 |
| 2013 | $4,823 | $55,270 | $11,770 | $43,500 |
Source: Public Records
Map
Nearby Homes
- 2321 Hudson Cir Unit 2701
- 452 Jamestown Ct Unit 506
- 2333 Stoughton Cir Unit 350206
- 530 Wolverine Dr
- 369 Vaughn Cir
- 2314 Reflections Dr Unit C0602
- 255 Vaughn Rd
- 253 Vaughn Rd
- 251 Vaughn Rd
- 249 Vaughn Rd
- 229 Vaughn Rd
- 247 Vaughn Rd
- 227 Vaughn Rd
- 1900 E New York St
- 1048 Asbury Dr
- 38 Breckenridge Dr
- 23 Westmoor Ct
- 45 Brookshire Ct
- 33 Forestview Ln
- 1015 Woodview Ct
- 2303 Hudson Cir Unit 2803
- 2307 Hudson Cir Unit 2802
- 2293 Hudson Cir Unit 2901
- 2289 Hudson Cir Unit 2902
- 2289 Hudson Cir Unit 2
- 2285 Hudson Cir Unit 2903
- 2283 Hudson Cir Unit 2904
- 2311 Hudson Cir Unit 2706
- 2313 Hudson Cir Unit 2705
- 2301 Hudson Cir Unit 3205
- 2297 Hudson Cir Unit 3204
- 2295 Hudson Cir Unit 3203
- 2305 Hudson Cir Unit 3206
- 2291 Hudson Cir Unit 3202
- 2315 Hudson Cir Unit 2704
- 2287 Hudson Cir Unit 3201
- 2317 Hudson Cir Unit 2703
- 2271 Hudson Cir Unit 3001
- 2319 Hudson Cir Unit 2702
- 2269 Hudson Cir Unit 3002
Your Personal Tour Guide
Ask me questions while you tour the home.