23 Annie Laurie St Mountain View, CA 94043
Whisman NeighborhoodEstimated Value: $1,843,000 - $2,043,549
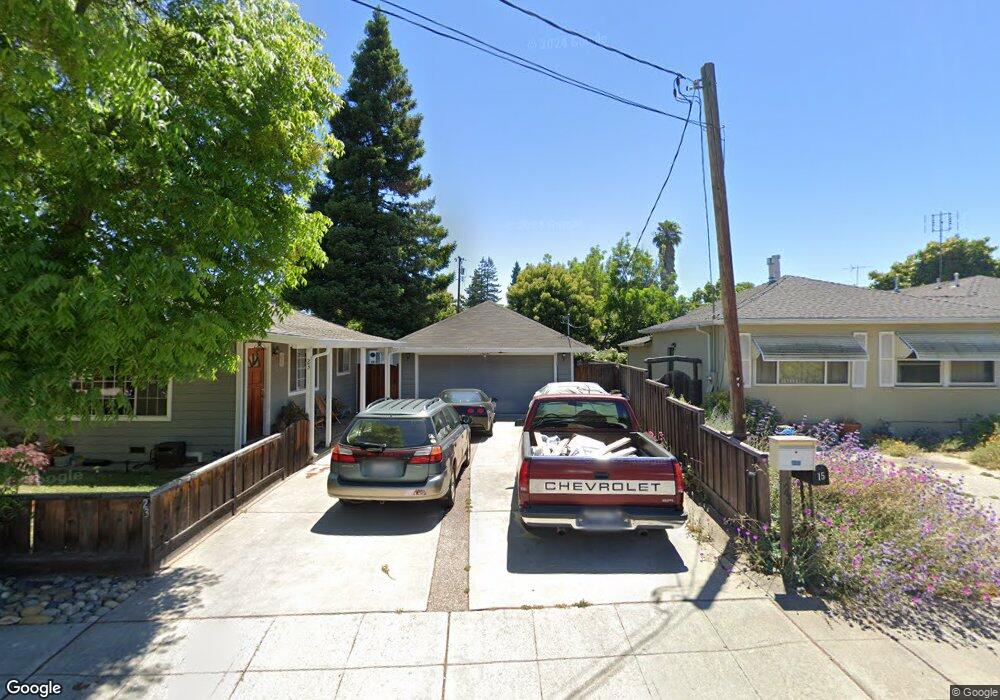
About This Home
This home is located at 23 Annie Laurie St, Mountain View, CA 94043 and is currently estimated at $1,945,137, approximately $2,835 per square foot. 23 Annie Laurie St is a home located in Santa Clara County with nearby schools including Amy Imai Elementary School, Crittenden Middle School, and Mountain View High School.
Ownership History
We collect this data history from publicly available records. To have your information removed, we recommend requesting removal directly through your county’s website.
Purchase Details
Purchase Details
Purchase Details
Purchase Details
Home Financials for this Owner
Home Financials are based on the most recent Mortgage that was taken out on this home.Home Values in the Area
Average Home Value in this Area
Purchase History
We collect this data history from publicly available records. To have your information removed, we recommend requesting removal directly through your county’s website.
| Date | Buyer | Sale Price | Title Company |
|---|---|---|---|
| -- | None Available | ||
| -- | None Available | ||
| -- | None Available | ||
| -- | None Available | ||
| -- | First American Title Company |
Mortgage History
We collect this data history from publicly available records. To have your information removed, we recommend requesting removal directly through your county’s website.
| Date | Status | Borrower | Loan Amount |
|---|---|---|---|
| Closed | $119,000 | ||
| Closed | $25,000 |
Tax History
We collect this data history from publicly available records. To have your information removed, we recommend requesting removal directly through your county’s website.
| Year | Tax Paid | Tax Assessment Tax Assessment Total Assessment is a certain percentage of the fair market value that is determined by local assessors to be the total taxable value of land and additions on the property. | Land | Improvement |
|---|---|---|---|---|
| 2025 | $3,892 | $314,496 | $165,269 | $149,227 |
| 2024 | $3,892 | $308,330 | $162,029 | $146,301 |
| 2023 | $3,853 | $302,285 | $158,852 | $143,433 |
| 2022 | $3,840 | $296,359 | $155,738 | $140,621 |
| 2021 | $3,749 | $290,549 | $152,685 | $137,864 |
| 2020 | $3,753 | $287,571 | $151,120 | $136,451 |
| 2019 | $3,604 | $281,933 | $148,157 | $133,776 |
| 2018 | $3,578 | $276,405 | $145,252 | $131,153 |
| 2017 | $3,358 | $270,986 | $142,404 | $128,582 |
| 2016 | $3,208 | $265,673 | $139,612 | $126,061 |
| 2015 | $3,119 | $261,683 | $137,515 | $124,168 |
| 2014 | $3,092 | $256,558 | $134,822 | $121,736 |
Map
- 270 Ariana Place
- 363 Tyrella Ave Unit C
- 124 Flynn Ave Unit A
- 100 E Middlefield Rd Unit 3B
- 100 E Middlefield Rd
- 201 Flynn Ave Unit 16
- 201 Flynn Ave Unit 13
- 663 Alamo Ct
- 264 N Whisman Rd Unit 13
- 500 W Middlefield Rd Unit 41
- 500 W Middlefield Rd Unit 170
- 500 W Middlefield Rd Unit 20
- 3702 Pyramid Way
- 905 W Middlefield Rd Unit 917
- 905 W Middlefield Rd Unit 971
- 118 Minaret Ave
- 440 Moffett Blvd Unit 84
- 440 Moffett Blvd Unit 86
- 189 Bedford Loop Unit 82
- 334 Circuit Way
- 15 Annie Laurie St
- 29 Annie Laurie St
- 33 Annie Laurie St
- 22 Annie Laurie St
- 16 Dorchester Dr
- 26 Dorchester Dr
- 26 Annie Laurie St
- 20 Annie Laurie St
- 25 Devonshire Ave
- 108 Murlagan Ave
- 192 Murlagan Ave
- 34 Dorchester Dr
- 32 Annie Laurie St
- 86 Murlagan Ave
- 40 Annie Laurie St
- 80 Murlagan Ave
- 17 Dorchester Dr
- 29 Dorchester Dr
- 54 Annie Laurie St Unit A
- 54 Annie Laurie St
Ask me questions while you tour the home.