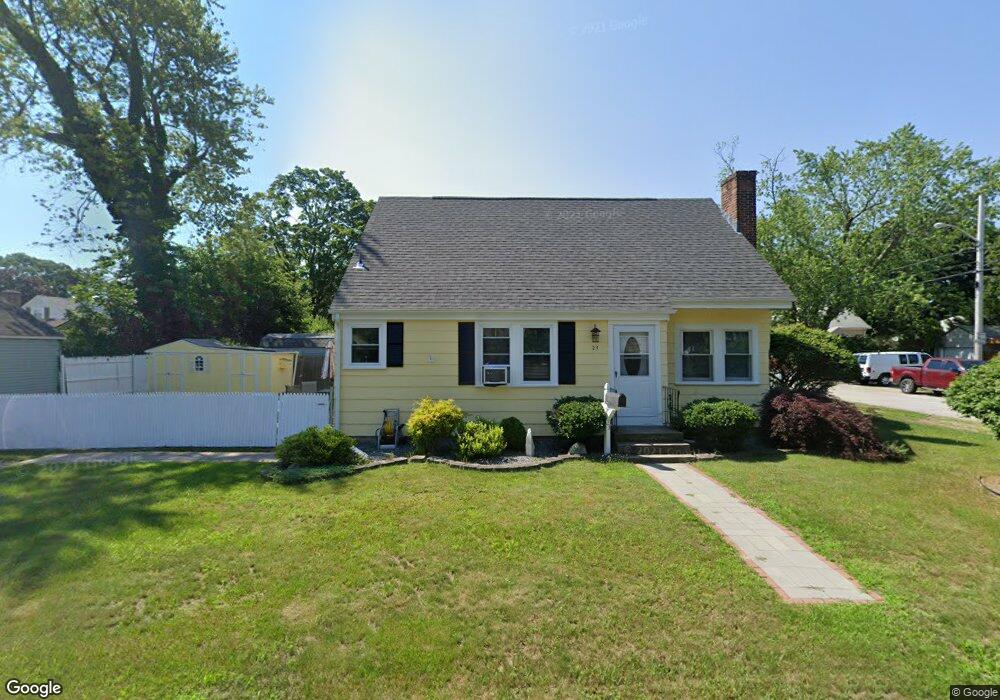
23 Benedict St Riverside, RI 02915
Riverside NeighborhoodEstimated Value: $446,000 - $517,000
3
Beds
2
Baths
1,400
Sq Ft
$335/Sq Ft
Est. Value
About This Home
This home is located at 23 Benedict St, Riverside, RI 02915 and is currently estimated at $469,247, approximately $335 per square foot. 23 Benedict St is a home located in Providence County with nearby schools including East Providence High School, St Luke Elementary School, and St Mary Academy-Bay View.
Ownership History
Date
Name
Owned For
Owner Type
Purchase Details
Closed on
Jan 29, 1993
Sold by
Flynn Joseph F and Flynn Helen
Bought by
Hurley Thomas M and Hurley Maureen
Current Estimated Value
Home Financials for this Owner
Home Financials are based on the most recent Mortgage that was taken out on this home.
Original Mortgage
$114,021
Interest Rate
8.16%
Create a Home Valuation Report for This Property
The Home Valuation Report is an in-depth analysis detailing your home's value as well as a comparison with similar homes in the area
Home Values in the Area
Average Home Value in this Area
Purchase History
| Date | Buyer | Sale Price | Title Company |
|---|---|---|---|
| Hurley Thomas M | $116,000 | -- |
Source: Public Records
Mortgage History
| Date | Status | Borrower | Loan Amount |
|---|---|---|---|
| Open | Hurley Thomas M | $117,536 | |
| Closed | Hurley Thomas M | $110,412 | |
| Closed | Hurley Thomas M | $114,021 |
Source: Public Records
Tax History
| Year | Tax Paid | Tax Assessment Tax Assessment Total Assessment is a certain percentage of the fair market value that is determined by local assessors to be the total taxable value of land and additions on the property. | Land | Improvement |
|---|---|---|---|---|
| 2025 | $5,137 | $393,000 | $126,300 | $266,700 |
| 2024 | $4,795 | $312,800 | $105,200 | $207,600 |
| 2023 | $4,617 | $312,800 | $105,200 | $207,600 |
| 2022 | $4,265 | $195,100 | $57,900 | $137,200 |
| 2021 | $4,195 | $195,100 | $56,600 | $138,500 |
| 2020 | $4,017 | $195,100 | $56,600 | $138,500 |
| 2019 | $3,906 | $195,100 | $56,600 | $138,500 |
| 2018 | $4,249 | $185,700 | $55,100 | $130,600 |
| 2017 | $4,154 | $185,700 | $55,100 | $130,600 |
| 2016 | $4,134 | $185,700 | $55,100 | $130,600 |
| 2015 | $4,076 | $177,600 | $51,000 | $126,600 |
| 2014 | $4,076 | $177,600 | $51,000 | $126,600 |
Source: Public Records
Map
Nearby Homes
- 14 Benedict St
- 14 Winthrop St
- 85 Hilton Ave
- 15 Claire St
- 23 Albert Ave
- 103 Burnside Ave
- 25 Arnold St
- 6 Hazelton Rd
- 41 White Ave
- 33 Pine St Unit 35
- 45 Washington Rd
- 56 Knowlton St
- 151 Willett Ave Unit 2
- 85 Hospital Rd
- 0 Carousel Dr
- 28 Jefferson Ave
- 65 Estrell Dr
- 916 Bullocks Pt Ave
- 6 Ledge Rd
- 43 Bullocks Point Ave Unit 4A
Your Personal Tour Guide
Ask me questions while you tour the home.