Estimated Value: $566,000 - $624,377
3
Beds
3
Baths
1,803
Sq Ft
$332/Sq Ft
Est. Value
About This Home
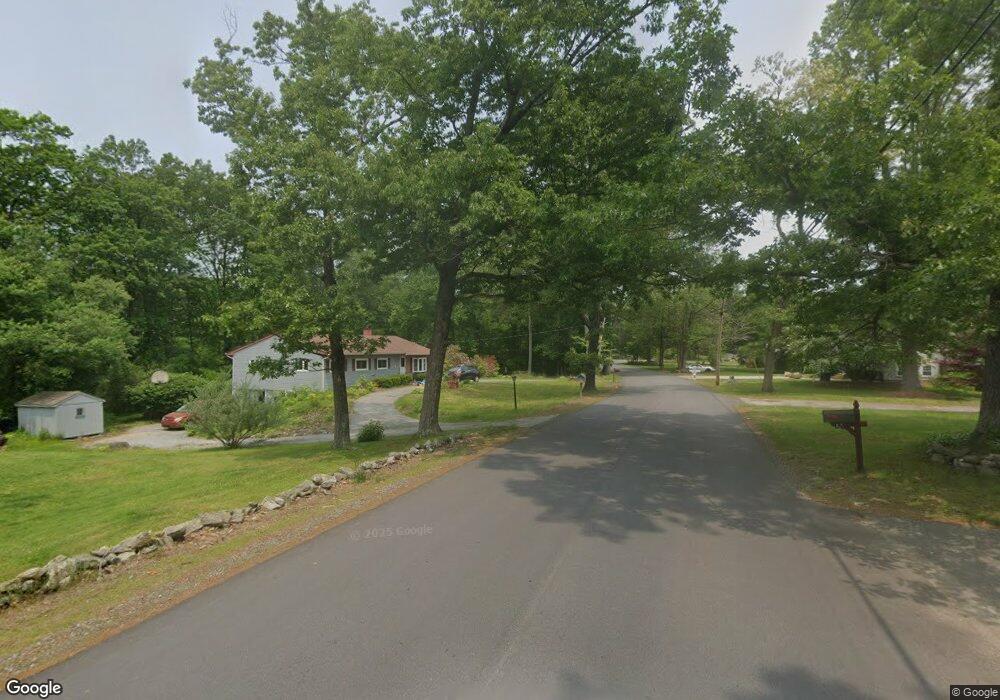
This home is located at 23 Berry Rd, Derry, NH 03038 and is currently estimated at $598,594, approximately $331 per square foot. 23 Berry Rd is a home located in Rockingham County with nearby schools including South Range Elementary School, West Running Brook Middle School, and Pinkerton Academy.
Ownership History
Date
Name
Owned For
Owner Type
Purchase Details
Closed on
Feb 2, 2017
Sold by
Oneil Thomas K
Bought by
White Jacob and White Sarah
Current Estimated Value
Home Financials for this Owner
Home Financials are based on the most recent Mortgage that was taken out on this home.
Original Mortgage
$216,000
Outstanding Balance
$178,911
Interest Rate
4.3%
Mortgage Type
Purchase Money Mortgage
Estimated Equity
$419,683
Purchase Details
Closed on
Jun 11, 2002
Sold by
Clark Les H
Bought by
White Douglas A and White Carol B
Home Financials for this Owner
Home Financials are based on the most recent Mortgage that was taken out on this home.
Original Mortgage
$179,920
Interest Rate
6.9%
Purchase Details
Closed on
Aug 9, 1996
Sold by
Keegan Thomas P and Keegan Elaine M
Bought by
Clark Les H
Create a Home Valuation Report for This Property
The Home Valuation Report is an in-depth analysis detailing your home's value as well as a comparison with similar homes in the area
Home Values in the Area
Average Home Value in this Area
Purchase History
| Date | Buyer | Sale Price | Title Company |
|---|---|---|---|
| White Jacob | $270,000 | -- | |
| White Jacob | $270,000 | -- | |
| White Douglas A | $225,000 | -- | |
| White Douglas A | $225,000 | -- | |
| Clark Les H | $115,800 | -- | |
| Clark Les H | $115,800 | -- |
Source: Public Records
Mortgage History
| Date | Status | Borrower | Loan Amount |
|---|---|---|---|
| Open | White Jacob | $216,000 | |
| Closed | White Jacob | $216,000 | |
| Previous Owner | Clark Les H | $122,557 | |
| Previous Owner | Clark Les H | $55,000 | |
| Previous Owner | Clark Les H | $179,920 |
Source: Public Records
Tax History Compared to Growth
Tax History
| Year | Tax Paid | Tax Assessment Tax Assessment Total Assessment is a certain percentage of the fair market value that is determined by local assessors to be the total taxable value of land and additions on the property. | Land | Improvement |
|---|---|---|---|---|
| 2024 | $10,717 | $573,400 | $230,800 | $342,600 |
| 2023 | $9,589 | $463,700 | $196,200 | $267,500 |
| 2022 | $8,829 | $463,700 | $196,200 | $267,500 |
| 2021 | $8,396 | $339,100 | $150,100 | $189,000 |
| 2020 | $6,046 | $339,100 | $150,100 | $189,000 |
| 2019 | $5,906 | $291,400 | $101,000 | $190,400 |
| 2018 | $7,585 | $291,400 | $101,000 | $190,400 |
| 2017 | $7,544 | $261,400 | $96,000 | $165,400 |
| 2016 | $7,195 | $265,900 | $96,000 | $169,900 |
| 2015 | $6,612 | $226,200 | $96,000 | $130,200 |
| 2014 | $6,655 | $226,200 | $96,000 | $130,200 |
| 2013 | $6,789 | $215,600 | $94,000 | $121,600 |
Source: Public Records
Map
Nearby Homes
- 13 Craven Terrace
- 139 Rockingham Rd Unit 21
- 139 Rockingham Rd Unit 30
- 144 Rockingham Rd
- 100 Rockingham Rd Unit 9
- 5 Sunnyside Ln Unit R
- 5A Homestead Dr Unit A
- 5A Homestead Dr
- 90L Derryfield Rd
- 90L Derryfield Rd Unit L
- 30 Kendall Pond Rd Unit 77
- 30 Kendall Pond Rd Unit 87
- 66 Derryfield Rd Unit L
- 65 Fordway Extension Unit 211
- 23 Oak St
- 23 Pleasant St
- 37 Highland Ave Unit 1
- 8 Birch St
- 7 Dexter St
- 24 South Ave