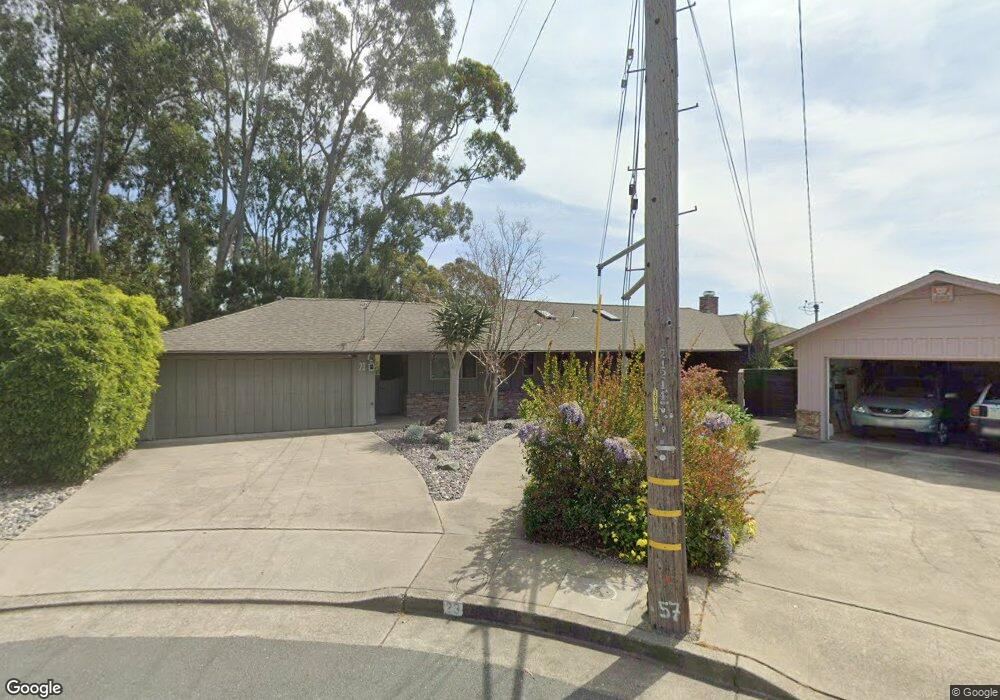
23 Brentwood Place Oakland, CA 94602
Oakmore NeighborhoodEstimated Value: $1,603,000 - $2,294,000
4
Beds
2
Baths
2,146
Sq Ft
$845/Sq Ft
Est. Value
About This Home
This home is located at 23 Brentwood Place, Oakland, CA 94602 and is currently estimated at $1,813,253, approximately $844 per square foot. 23 Brentwood Place is a home located in Alameda County with nearby schools including Joaquin Miller Elementary School, Montera Middle School, and Skyline High School.
Ownership History
Date
Name
Owned For
Owner Type
Purchase Details
Closed on
Mar 3, 2016
Sold by
Hazenfield Carol A and The Carol A Hazenfield Revocab
Bought by
Korn Daniel Gordon and Russell Jennifer Yvette
Current Estimated Value
Home Financials for this Owner
Home Financials are based on the most recent Mortgage that was taken out on this home.
Original Mortgage
$1,030,000
Outstanding Balance
$817,132
Interest Rate
3.72%
Mortgage Type
New Conventional
Estimated Equity
$996,121
Purchase Details
Closed on
Nov 18, 2009
Sold by
Lijphart Antony S and Hazenfield Carol A
Bought by
Hazenfield Carol A and Hazenfield Revocable T Carol A
Purchase Details
Closed on
Sep 11, 2009
Sold by
Batavia Clyde and G & K Batavia 1989 Family Trus
Bought by
Lijphart Antony S and Hazenfield Carol A
Create a Home Valuation Report for This Property
The Home Valuation Report is an in-depth analysis detailing your home's value as well as a comparison with similar homes in the area
Home Values in the Area
Average Home Value in this Area
Purchase History
| Date | Buyer | Sale Price | Title Company |
|---|---|---|---|
| Korn Daniel Gordon | $1,530,000 | Chicago Title Company | |
| Hazenfield Carol A | -- | None Available | |
| Lijphart Antony S | $840,000 | Fidelity National Title Co |
Source: Public Records
Mortgage History
| Date | Status | Borrower | Loan Amount |
|---|---|---|---|
| Open | Korn Daniel Gordon | $1,030,000 |
Source: Public Records
Tax History Compared to Growth
Tax History
| Year | Tax Paid | Tax Assessment Tax Assessment Total Assessment is a certain percentage of the fair market value that is determined by local assessors to be the total taxable value of land and additions on the property. | Land | Improvement |
|---|---|---|---|---|
| 2025 | $24,526 | $1,804,167 | $543,350 | $1,267,817 |
| 2024 | $24,526 | $1,768,656 | $532,697 | $1,242,959 |
| 2023 | $25,947 | $1,740,848 | $522,254 | $1,218,594 |
| 2022 | $25,405 | $1,699,714 | $512,014 | $1,194,700 |
| 2021 | $24,630 | $1,666,253 | $501,976 | $1,171,277 |
| 2020 | $24,358 | $1,656,101 | $496,830 | $1,159,271 |
| 2019 | $23,657 | $1,623,635 | $487,090 | $1,136,545 |
| 2018 | $23,146 | $1,591,811 | $477,543 | $1,114,268 |
| 2017 | $22,339 | $1,560,600 | $468,180 | $1,092,420 |
| 2016 | $13,509 | $915,918 | $274,775 | $641,143 |
| 2015 | $13,432 | $902,167 | $270,650 | $631,517 |
| 2014 | $13,470 | $884,502 | $265,350 | $619,152 |
Source: Public Records
Map
Nearby Homes
- 4445 Arcadia Ave
- 1975 Wrenn St
- 2093 Braemar Rd
- 1942 Leimert Blvd
- 1842 Brentwood Rd
- 1989 Oakview Dr
- 4271 Whittle Ave
- 4751 Lincoln Ave
- 4081 Waterhouse Rd
- 37 Coolidge Terrace
- 2436 Potomac St
- 2471 Burlington St
- 180 Maiden Ln
- 389 Somerset Rd
- 5040 Pierpoint Ave
- 4019 Rhoda Ave
- 1124 Hollywood Ave Unit 3
- 2818 Steinmetz Way
- 19 Brentwood Place
- 2035 Melvin Rd
- 20 Brentwood Place
- 2033 Melvin Rd
- 2037 Melvin Rd
- 11 Brentwood Place
- 4427 Arcadia Ave
- 4433 Arcadia Ave
- 2039 Melvin Rd
- 4425 Arcadia Ave
- 16 Brentwood Place
- 2041 Melvin Rd
- 4455 Arcadia Ave
- 4421 Arcadia Ave
- 1955 Melvin Rd
- 2 Brentwood Place
- 0 Arcadia Ave
- 4409 Arcadia Ave
- 4494 Arcadia Ave
- 1949 Melvin Rd