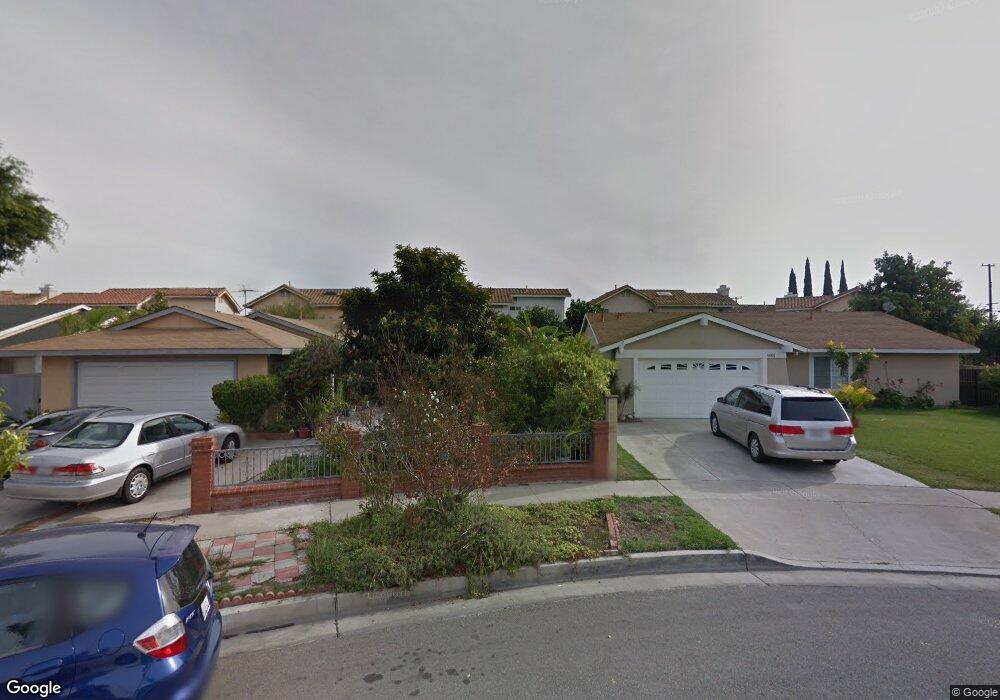
23 Cantera Santa Ana, CA 92703
Riverview West NeighborhoodEstimated Value: $776,000 - $908,000
3
Beds
3
Baths
1,481
Sq Ft
$560/Sq Ft
Est. Value
About This Home
This home is located at 23 Cantera, Santa Ana, CA 92703 and is currently estimated at $828,833, approximately $559 per square foot. 23 Cantera is a home located in Orange County with nearby schools including Rosita Elementary School, James Irvine Intermediate School, and Bolsa Grande High School.
Ownership History
Date
Name
Owned For
Owner Type
Purchase Details
Closed on
Nov 18, 2019
Sold by
Kwoen Timothy K
Bought by
Kwoen Alicia Mi
Current Estimated Value
Purchase Details
Closed on
Apr 14, 2007
Sold by
Tran Mike M and Tran Phuong Quynh
Bought by
Tran Mike M
Purchase Details
Closed on
Feb 9, 2007
Sold by
Tran Charlie C
Bought by
Tran Mike M
Purchase Details
Closed on
Feb 14, 2003
Sold by
Tran Mike Minh
Bought by
Tran Charlie C
Purchase Details
Closed on
Feb 1, 2002
Sold by
Tran Mike Minh and Tran Vivian Nina
Bought by
Tran Mike Minh
Purchase Details
Closed on
Mar 10, 1998
Sold by
Brown Lester C and Owens Kathy Owens
Bought by
Tran Michael Minh
Home Financials for this Owner
Home Financials are based on the most recent Mortgage that was taken out on this home.
Original Mortgage
$136,000
Interest Rate
7.07%
Create a Home Valuation Report for This Property
The Home Valuation Report is an in-depth analysis detailing your home's value as well as a comparison with similar homes in the area
Home Values in the Area
Average Home Value in this Area
Purchase History
| Date | Buyer | Sale Price | Title Company |
|---|---|---|---|
| Kwoen Alicia Mi | -- | None Available | |
| Tran Mike M | -- | None Available | |
| Tran Mike M | -- | None Available | |
| Tran Charlie C | -- | Fidelity National Title | |
| Tran Mike Minh | -- | Orange Coast Title | |
| Tran Michael Minh | $170,000 | Fidelity National Title Ins |
Source: Public Records
Mortgage History
| Date | Status | Borrower | Loan Amount |
|---|---|---|---|
| Previous Owner | Tran Michael Minh | $136,000 |
Source: Public Records
Tax History Compared to Growth
Tax History
| Year | Tax Paid | Tax Assessment Tax Assessment Total Assessment is a certain percentage of the fair market value that is determined by local assessors to be the total taxable value of land and additions on the property. | Land | Improvement |
|---|---|---|---|---|
| 2025 | $3,352 | $271,438 | $91,155 | $180,283 |
| 2024 | $3,352 | $266,116 | $89,367 | $176,749 |
| 2023 | $3,289 | $260,899 | $87,615 | $173,284 |
| 2022 | $3,214 | $255,784 | $85,897 | $169,887 |
| 2021 | $3,170 | $250,769 | $84,213 | $166,556 |
| 2020 | $3,132 | $248,198 | $83,349 | $164,849 |
| 2019 | $3,093 | $243,332 | $81,715 | $161,617 |
| 2018 | $3,018 | $238,561 | $80,112 | $158,449 |
| 2017 | $2,988 | $233,884 | $78,541 | $155,343 |
| 2016 | $2,861 | $229,299 | $77,001 | $152,298 |
| 2015 | $2,823 | $225,855 | $75,844 | $150,011 |
| 2014 | $2,757 | $221,431 | $74,358 | $147,073 |
Source: Public Records
Map
Nearby Homes
- 1609 N Parsons Place
- 13322 Euclid St
- 11321 Parkgreen Ln Unit 102
- 10886 Lotus Dr
- 1114 N Gates St
- 14356 Taft St
- 5317 Silver Dr
- 4832 W 5th St Unit B
- 14151 Lake St
- 4201 W 5th St Unit 314
- 323 N Euclid St Unit 99
- 5405 W 4th St
- 526 W Tribella Ct
- 13611 Glenhaven Dr
- 4248 W 5th St
- 3929 W 5th St Unit 16
- 3932 W 5th St Unit 202
- 4518 W 1st St
- 5114 W 1st St Unit C
- 1314 N Bewley St