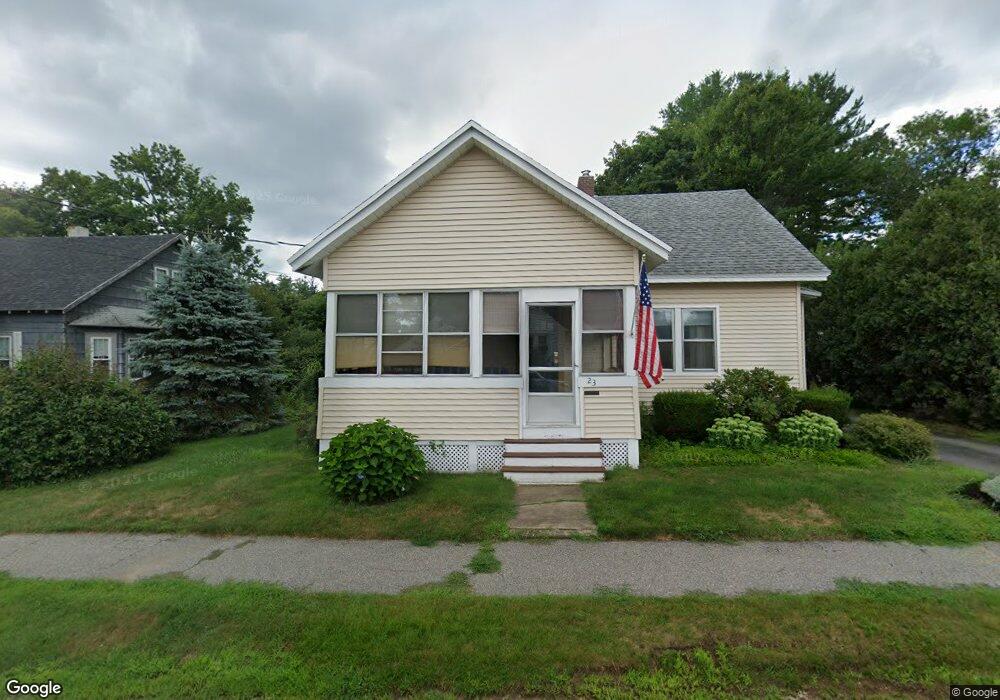
23 Carter St Concord, NH 03301
South End NeighborhoodEstimated Value: $486,000 - $619,000
3
Beds
2
Baths
2,151
Sq Ft
$253/Sq Ft
Est. Value
About This Home
This home is located at 23 Carter St, Concord, NH 03301 and is currently estimated at $543,153, approximately $252 per square foot. 23 Carter St is a home with nearby schools including Abbot-Downing School, Rundlett Middle School, and Concord High School.
Ownership History
Date
Name
Owned For
Owner Type
Purchase Details
Closed on
May 31, 2019
Sold by
Sorette Bruce W and Sorette Sharon H
Bought by
Borho Megan F and Reid Tyler E
Current Estimated Value
Home Financials for this Owner
Home Financials are based on the most recent Mortgage that was taken out on this home.
Original Mortgage
$236,000
Outstanding Balance
$205,767
Interest Rate
4.1%
Mortgage Type
New Conventional
Estimated Equity
$337,386
Purchase Details
Closed on
Sep 20, 1990
Bought by
Sorette Bruce W and Sorette Sharon H
Create a Home Valuation Report for This Property
The Home Valuation Report is an in-depth analysis detailing your home's value as well as a comparison with similar homes in the area
Home Values in the Area
Average Home Value in this Area
Purchase History
| Date | Buyer | Sale Price | Title Company |
|---|---|---|---|
| Borho Megan F | $295,000 | -- | |
| Sorette Bruce W | $100,000 | -- |
Source: Public Records
Mortgage History
| Date | Status | Borrower | Loan Amount |
|---|---|---|---|
| Open | Borho Megan F | $236,000 | |
| Previous Owner | Sorette Bruce W | $145,000 | |
| Previous Owner | Sorette Bruce W | $147,450 | |
| Previous Owner | Sorette Bruce W | $50,000 |
Source: Public Records
Tax History
| Year | Tax Paid | Tax Assessment Tax Assessment Total Assessment is a certain percentage of the fair market value that is determined by local assessors to be the total taxable value of land and additions on the property. | Land | Improvement |
|---|---|---|---|---|
| 2025 | $10,413 | $357,700 | $121,400 | $236,300 |
| 2024 | $9,905 | $357,700 | $121,400 | $236,300 |
| 2023 | $9,608 | $357,700 | $121,400 | $236,300 |
| 2022 | $9,261 | $357,700 | $121,400 | $236,300 |
| 2021 | $8,985 | $357,700 | $121,400 | $236,300 |
| 2020 | $8,949 | $334,400 | $101,800 | $232,600 |
| 2019 | $6,789 | $244,400 | $89,100 | $155,300 |
| 2018 | $6,923 | $245,600 | $92,100 | $153,500 |
| 2017 | $6,780 | $240,100 | $92,100 | $148,000 |
| 2016 | $6,386 | $230,800 | $90,300 | $140,500 |
| 2015 | $6,217 | $227,400 | $101,200 | $126,200 |
| 2014 | $6,097 | $227,400 | $101,200 | $126,200 |
| 2013 | $5,756 | $225,000 | $101,200 | $123,800 |
| 2012 | $5,629 | $231,000 | $110,700 | $120,300 |
Source: Public Records
Map
Nearby Homes
- 0 South St Unit 4969509
- 47 Noyes St
- 273-279 S Main St
- 335 S Main St
- 47 South St
- 33 Joffre St
- 58 S State St
- 40 Nivelle St
- 111 -113 South Main St
- 7-9 Myrtle St
- 289 South St
- 25 N Spring St
- 30 Longmeadow Dr
- 9 Forest St
- 135 Liberty St
- 22 Fairfield Dr
- 21 Fairfield Dr
- 20 Fairfield Dr
- 19 Grappone Dr
- 13-15 Walker St
Your Personal Tour Guide
Ask me questions while you tour the home.