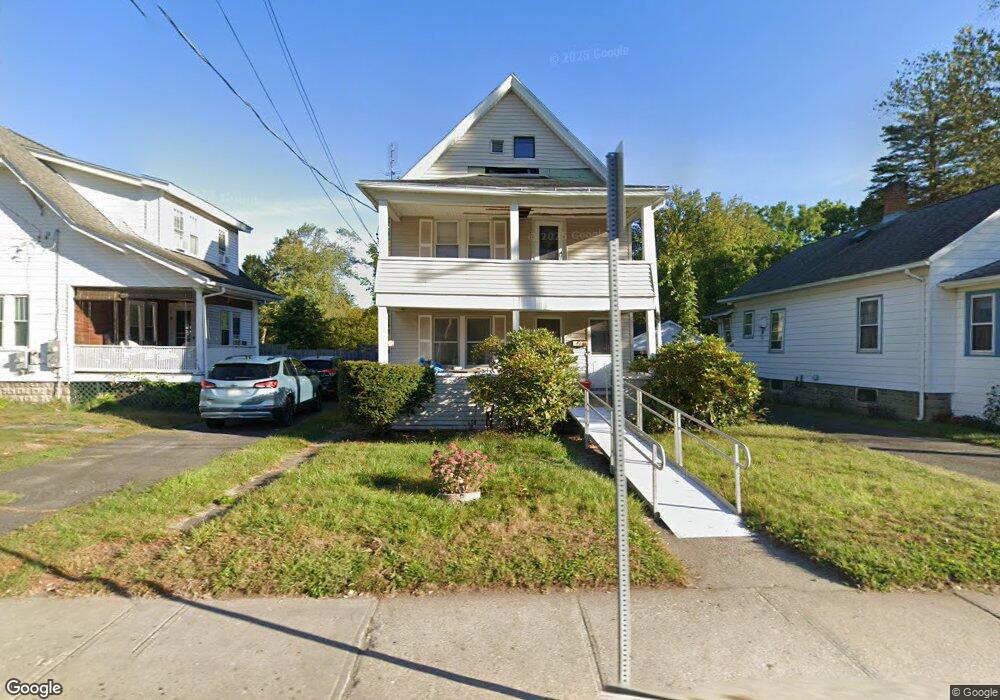
23 Clark St Easthampton, MA 01027
Estimated Value: $375,000 - $518,000
4
Beds
2
Baths
2,060
Sq Ft
$203/Sq Ft
Est. Value
About This Home
This home is located at 23 Clark St, Easthampton, MA 01027 and is currently estimated at $418,430, approximately $203 per square foot. 23 Clark St is a home located in Hampshire County with nearby schools including Easthampton High School, Tri-County Schools, and New England Adolescent Research Institute.
Ownership History
Date
Name
Owned For
Owner Type
Purchase Details
Closed on
Jan 19, 2007
Sold by
Lebeau Tina M
Bought by
Obrien Beverly W and Obrien Michael
Current Estimated Value
Home Financials for this Owner
Home Financials are based on the most recent Mortgage that was taken out on this home.
Original Mortgage
$135,000
Outstanding Balance
$80,361
Interest Rate
6.14%
Mortgage Type
Purchase Money Mortgage
Estimated Equity
$338,069
Purchase Details
Closed on
Nov 24, 2004
Sold by
Lebeau Tina M
Bought by
Lebeau Malvina
Home Financials for this Owner
Home Financials are based on the most recent Mortgage that was taken out on this home.
Original Mortgage
$100,000
Interest Rate
5.75%
Mortgage Type
Purchase Money Mortgage
Purchase Details
Closed on
Dec 29, 1989
Sold by
Lebeau Roland G-
Bought by
Lebeau Albert J
Create a Home Valuation Report for This Property
The Home Valuation Report is an in-depth analysis detailing your home's value as well as a comparison with similar homes in the area
Home Values in the Area
Average Home Value in this Area
Purchase History
| Date | Buyer | Sale Price | Title Company |
|---|---|---|---|
| Obrien Beverly W | $180,000 | -- | |
| Lebeau Malvina | -- | -- | |
| Lebeau Albert J | $135,000 | -- |
Source: Public Records
Mortgage History
| Date | Status | Borrower | Loan Amount |
|---|---|---|---|
| Open | Obrien Beverly W | $135,000 | |
| Previous Owner | Lebeau Albert J | $100,000 | |
| Previous Owner | Lebeau Albert J | $25,000 | |
| Previous Owner | Lebeau Albert J | $10,000 | |
| Previous Owner | Lebeau Albert J | $100,000 |
Source: Public Records
Tax History
| Year | Tax Paid | Tax Assessment Tax Assessment Total Assessment is a certain percentage of the fair market value that is determined by local assessors to be the total taxable value of land and additions on the property. | Land | Improvement |
|---|---|---|---|---|
| 2025 | $4,577 | $334,800 | $104,400 | $230,400 |
| 2024 | $4,412 | $325,400 | $101,400 | $224,000 |
| 2023 | $3,298 | $225,100 | $80,000 | $145,100 |
| 2022 | $3,721 | $225,100 | $80,000 | $145,100 |
| 2021 | $4,622 | $228,400 | $80,000 | $148,400 |
| 2020 | $4,508 | $225,100 | $80,000 | $145,100 |
| 2019 | $3,208 | $207,500 | $80,000 | $127,500 |
| 2018 | $3,144 | $196,500 | $75,500 | $121,000 |
| 2017 | $3,060 | $188,800 | $72,600 | $116,200 |
| 2016 | $2,943 | $188,800 | $72,600 | $116,200 |
| 2015 | $2,860 | $188,800 | $72,600 | $116,200 |
Source: Public Records
Map
Nearby Homes
- 40 Clark St
- 2 Oak St
- 4 Gaugh St
- 33 Knipfer Ave
- 19 Nicols Way Unit 19
- 7 Union Ct
- 12 Glen Cove Place Unit B
- 10 Glen Cove Place Unit A
- 18-20 Oakdale Place
- 29 Parsons St Unit 1
- 11 Dragon Cir
- 6 Wilton Rd
- 41 South St Unit 11
- 336 Main St
- 6 S St & Abutting Lots
- 385 Main St
- 2 W Park Dr
- M143 &152 Glendale St
- 36 & 36R Holly Cir
- 211 East St Unit 11
- 21 Clark St
- 25 Clark St
- 27 Clark St
- 19 Clark St
- 19 Clark St Unit 1st Fl
- 20 Clark St
- 17 Clark St
- 16 Clark St
- 29 Clark St
- 28 Clark St
- 15 Clark St
- 31 Clark St
- 13 Clark St
- 64 Maple St
- 66 Maple St
- 62 Maple St Unit Upper Level in Duple
- 62 Maple St Unit 6 months in Easthamp
- 33 Clark St
- 32 Clark St
- 60 Maple St Unit 62
Your Personal Tour Guide
Ask me questions while you tour the home.