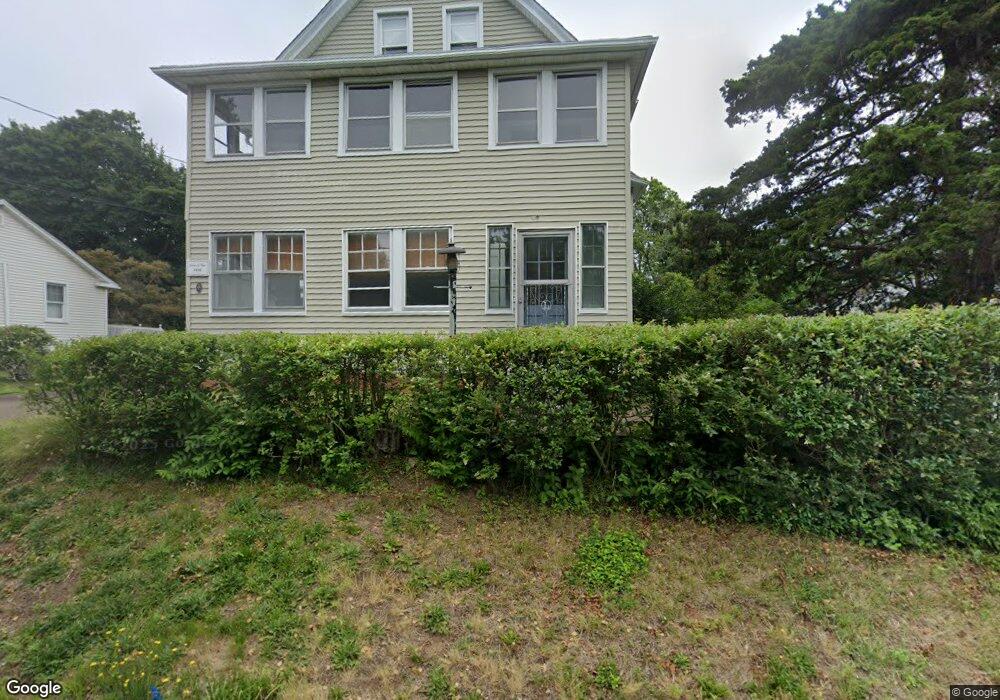
23 Curve St Branford, CT 06405
Estimated Value: $487,000 - $538,000
3
Beds
4
Baths
1,948
Sq Ft
$260/Sq Ft
Est. Value
About This Home
This home is located at 23 Curve St, Branford, CT 06405 and is currently estimated at $505,562, approximately $259 per square foot. 23 Curve St is a home located in New Haven County with nearby schools including Francis Walsh Intermediate School, Branford High School, and East Shoreline Catholic Academy.
Ownership History
Date
Name
Owned For
Owner Type
Purchase Details
Closed on
Jun 6, 2003
Sold by
Cummings Diane and Dymarezk Joseph
Bought by
Merrick Scott F and Merrick Joan P
Current Estimated Value
Home Financials for this Owner
Home Financials are based on the most recent Mortgage that was taken out on this home.
Original Mortgage
$184,000
Outstanding Balance
$80,893
Interest Rate
5.83%
Estimated Equity
$424,669
Create a Home Valuation Report for This Property
The Home Valuation Report is an in-depth analysis detailing your home's value as well as a comparison with similar homes in the area
Home Values in the Area
Average Home Value in this Area
Purchase History
| Date | Buyer | Sale Price | Title Company |
|---|---|---|---|
| Merrick Scott F | $230,000 | -- |
Source: Public Records
Mortgage History
| Date | Status | Borrower | Loan Amount |
|---|---|---|---|
| Open | Merrick Scott F | $184,000 | |
| Previous Owner | Merrick Scott F | $63,000 |
Source: Public Records
Tax History Compared to Growth
Tax History
| Year | Tax Paid | Tax Assessment Tax Assessment Total Assessment is a certain percentage of the fair market value that is determined by local assessors to be the total taxable value of land and additions on the property. | Land | Improvement |
|---|---|---|---|---|
| 2025 | $6,375 | $297,900 | $80,100 | $217,800 |
| 2024 | $5,621 | $184,400 | $67,600 | $116,800 |
| 2023 | $5,512 | $184,400 | $67,600 | $116,800 |
| 2022 | $5,431 | $184,400 | $67,600 | $116,800 |
| 2021 | $5,431 | $184,400 | $67,600 | $116,800 |
| 2020 | $5,333 | $184,400 | $67,600 | $116,800 |
| 2019 | $5,204 | $179,000 | $67,600 | $111,400 |
| 2018 | $5,127 | $179,000 | $67,600 | $111,400 |
| 2017 | $5,096 | $179,000 | $67,600 | $111,400 |
| 2016 | $4,906 | $179,000 | $67,600 | $111,400 |
| 2015 | $4,820 | $179,000 | $67,600 | $111,400 |
| 2014 | $4,910 | $187,100 | $67,600 | $119,500 |
Source: Public Records
Map
Nearby Homes
- 60 Maple St Unit 40B
- 58 Quarry Dock Rd
- 74 Quarry Dock Rd
- 301 Maple St
- 18 Linsley St
- 26 N Main St Unit TRLR 19
- 29 Harbour Village Unit D
- 22 Rock Pasture Rd
- 21 Harbor St
- 22 Montoya Dr Unit 2
- 10 Eli Yale Terrace
- 25 S Montowese St
- 19 Stonegate Unit D
- 48 Montoya Dr Unit 48
- 62 S Montowese St
- 69 Montoya Dr
- 60 Montoya Dr Unit 60
- 73 Briarwood Ln Unit E
- 16 Pine Orchard Rd Unit 23
- 15 River Rd