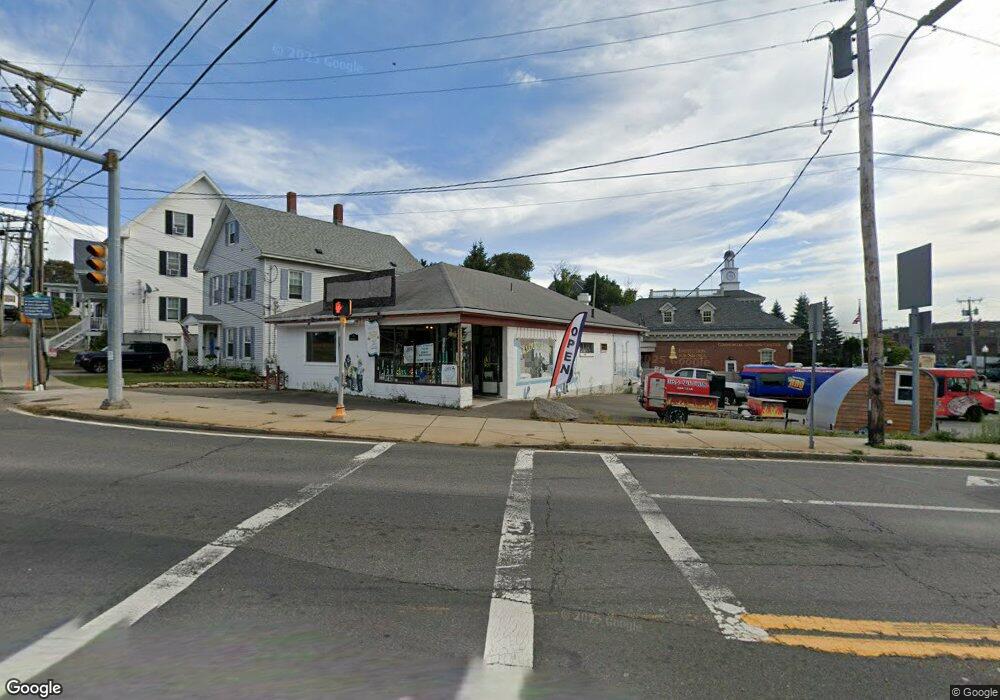
23 E Main St Gloucester, MA 01930
Central Gloucester NeighborhoodEstimated Value: $592,056
1
Bed
1
Bath
1,656
Sq Ft
$358/Sq Ft
Est. Value
About This Home
This home is located at 23 E Main St, Gloucester, MA 01930 and is currently estimated at $592,056, approximately $357 per square foot. 23 E Main St is a home located in Essex County with nearby schools including East Gloucester Elementary School, Ralph B O'maley Middle School, and Gloucester High School.
Ownership History
Date
Name
Owned For
Owner Type
Purchase Details
Closed on
Aug 17, 2022
Sold by
Crabs & Lobsters Llc
Bought by
Dyer Dennis A
Current Estimated Value
Purchase Details
Closed on
Mar 31, 2011
Sold by
Crabs And Lobster Llc
Bought by
Gloucester City Of
Purchase Details
Closed on
Feb 29, 2008
Sold by
32 East Main Street Rt
Bought by
Crabs & Lobsters Llc
Home Financials for this Owner
Home Financials are based on the most recent Mortgage that was taken out on this home.
Original Mortgage
$350,000
Interest Rate
5.8%
Mortgage Type
Commercial
Create a Home Valuation Report for This Property
The Home Valuation Report is an in-depth analysis detailing your home's value as well as a comparison with similar homes in the area
Home Values in the Area
Average Home Value in this Area
Purchase History
| Date | Buyer | Sale Price | Title Company |
|---|---|---|---|
| Dyer Dennis A | $530,000 | None Available | |
| Gloucester City Of | $910 | -- | |
| Gloucester City Of | $910 | -- | |
| Crabs & Lobsters Llc | $410,000 | -- | |
| Crabs & Lobsters Llc | $410,000 | -- |
Source: Public Records
Mortgage History
| Date | Status | Borrower | Loan Amount |
|---|---|---|---|
| Previous Owner | Crabs & Lobsters Llc | $350,000 | |
| Previous Owner | Crabs & Lobsters Llc | $50,000 |
Source: Public Records
Tax History
| Year | Tax Paid | Tax Assessment Tax Assessment Total Assessment is a certain percentage of the fair market value that is determined by local assessors to be the total taxable value of land and additions on the property. | Land | Improvement |
|---|---|---|---|---|
| 2025 | $4,683 | $466,400 | $251,700 | $214,700 |
| 2024 | $4,529 | $450,600 | $239,700 | $210,900 |
| 2023 | $4,607 | $421,100 | $214,000 | $207,100 |
| 2022 | $4,653 | $383,900 | $176,800 | $207,100 |
| 2021 | $4,848 | $377,300 | $160,700 | $216,600 |
| 2020 | $4,807 | $377,300 | $160,700 | $216,600 |
| 2019 | $4,897 | $373,500 | $160,700 | $212,800 |
| 2018 | $4,965 | $371,600 | $160,700 | $210,900 |
| 2017 | $4,884 | $358,300 | $153,100 | $205,200 |
| 2016 | $5,061 | $348,300 | $153,300 | $195,000 |
| 2015 | $5,234 | $359,000 | $153,300 | $205,700 |
Source: Public Records
Map
Nearby Homes
- 5 Wise Place
- 160 Prospect St Unit 3
- 26 Marina Dr
- 30 Chapel St Unit B
- 197 E Main St Unit 1
- 197 E Main St Unit 2
- 19 Trask St Unit 2
- 191 Main St Unit 3
- 191 Main St Unit 2A
- 113 Pleasant St
- 73 Rocky Neck Ave Unit 2
- 40 Sargent St
- 33 Maplewood Ave Unit 16
- 87 Atlantic Rd Unit 2
- 33 Middle St
- 98 Maplewood Ave
- 20 Beacon St Unit 2
- 20 Beacon St Unit 1
- 10 Seaview Rd
- 78 Thatcher Rd Unit 6
Your Personal Tour Guide
Ask me questions while you tour the home.