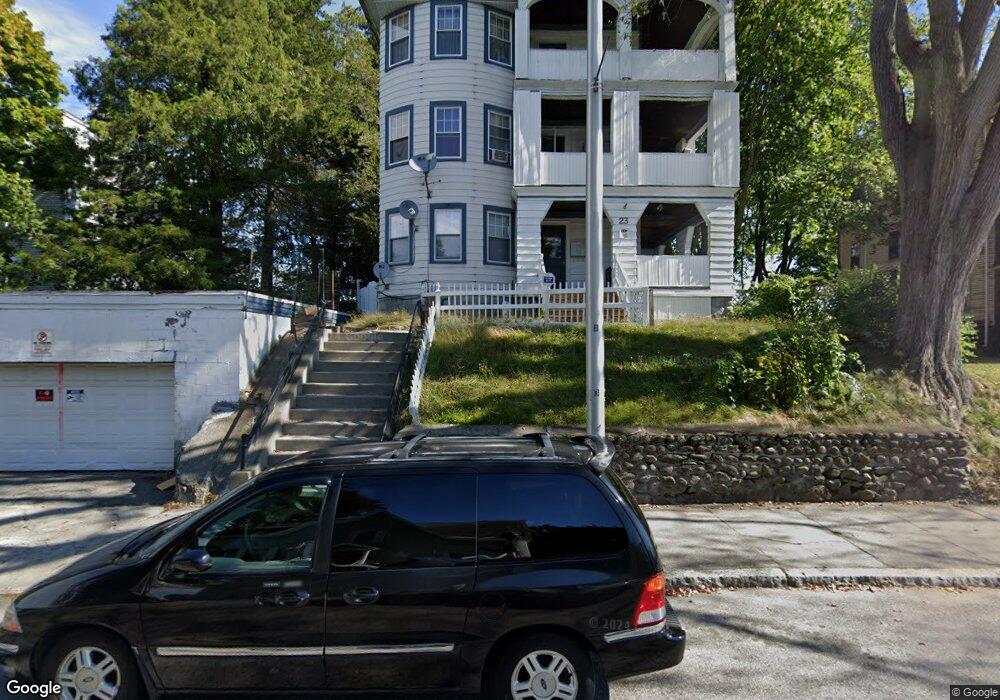
23 Gates St Worcester, MA 01610
Beacon Brightly NeighborhoodEstimated Value: $474,428 - $904,000
9
Beds
5
Baths
5,000
Sq Ft
$150/Sq Ft
Est. Value
About This Home
This home is located at 23 Gates St, Worcester, MA 01610 and is currently estimated at $748,857, approximately $149 per square foot. 23 Gates St is a home located in Worcester County with nearby schools including Goddard School of Science & Technology, Jacob Hiatt Magnet School, and Chandler Magnet.
Ownership History
Date
Name
Owned For
Owner Type
Purchase Details
Closed on
May 3, 1999
Sold by
Murray David J and Murray Diana L
Bought by
Alvarez Carlene H and Valencia Humberto A
Current Estimated Value
Purchase Details
Closed on
Feb 25, 1992
Sold by
Unibank For Svgs
Bought by
Murray David J and Murray Diane L
Purchase Details
Closed on
Oct 22, 1991
Sold by
Harr Mill Dev Corp
Bought by
Unibank For Svgs
Purchase Details
Closed on
Sep 1, 1989
Sold by
Faford Ralph
Bought by
Harr Mill Dev Co
Create a Home Valuation Report for This Property
The Home Valuation Report is an in-depth analysis detailing your home's value as well as a comparison with similar homes in the area
Home Values in the Area
Average Home Value in this Area
Purchase History
| Date | Buyer | Sale Price | Title Company |
|---|---|---|---|
| Alvarez Carlene H | $130,000 | -- | |
| Murray David J | $70,000 | -- | |
| Unibank For Svgs | $90,000 | -- | |
| Harr Mill Dev Co | $185,000 | -- |
Source: Public Records
Mortgage History
| Date | Status | Borrower | Loan Amount |
|---|---|---|---|
| Open | Harr Mill Dev Co | $127,000 | |
| Open | Harr Mill Dev Co | $252,000 |
Source: Public Records
Tax History
| Year | Tax Paid | Tax Assessment Tax Assessment Total Assessment is a certain percentage of the fair market value that is determined by local assessors to be the total taxable value of land and additions on the property. | Land | Improvement |
|---|---|---|---|---|
| 2025 | $7,728 | $585,900 | $65,200 | $520,700 |
| 2024 | $7,101 | $516,400 | $65,200 | $451,200 |
| 2023 | $6,754 | $471,000 | $51,600 | $419,400 |
| 2022 | $5,908 | $388,400 | $41,300 | $347,100 |
| 2021 | $5,994 | $368,200 | $33,000 | $335,200 |
| 2020 | $5,518 | $324,600 | $33,000 | $291,600 |
| 2019 | $5,357 | $297,600 | $31,500 | $266,100 |
| 2018 | $5,219 | $276,000 | $31,500 | $244,500 |
| 2017 | $4,878 | $253,800 | $31,500 | $222,300 |
| 2016 | $4,718 | $228,900 | $21,800 | $207,100 |
| 2015 | $4,594 | $228,900 | $21,800 | $207,100 |
| 2014 | $4,473 | $228,900 | $21,800 | $207,100 |
Source: Public Records
Map
Nearby Homes
Your Personal Tour Guide
Ask me questions while you tour the home.