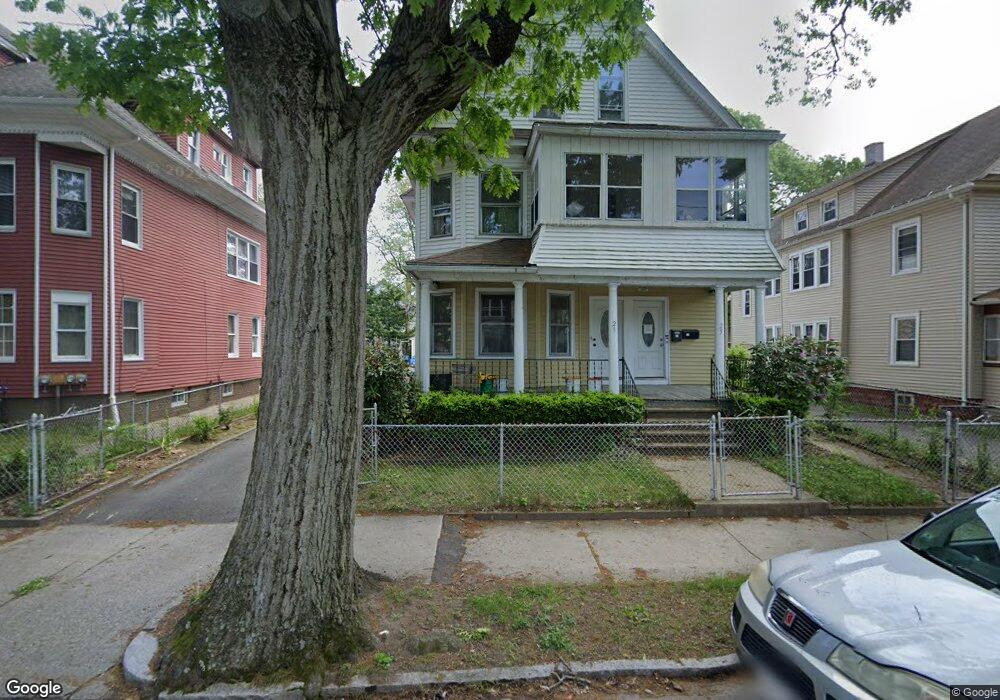
23 Gordon St Unit 25 Springfield, MA 01108
Forest Park NeighborhoodEstimated Value: $318,418 - $375,000
4
Beds
3
Baths
3,081
Sq Ft
$116/Sq Ft
Est. Value
About This Home
This home is located at 23 Gordon St Unit 25, Springfield, MA 01108 and is currently estimated at $356,355, approximately $115 per square foot. 23 Gordon St Unit 25 is a home located in Hampden County with nearby schools including White Street Elementary School, Forest Park Middle School, and High School Of Commerce.
Ownership History
Date
Name
Owned For
Owner Type
Purchase Details
Closed on
Sep 27, 1996
Sold by
Giancola Egidio O
Bought by
Ta Tung H and Ta Truc H
Current Estimated Value
Home Financials for this Owner
Home Financials are based on the most recent Mortgage that was taken out on this home.
Original Mortgage
$65,475
Outstanding Balance
$5,873
Interest Rate
7.83%
Mortgage Type
Purchase Money Mortgage
Estimated Equity
$350,482
Create a Home Valuation Report for This Property
The Home Valuation Report is an in-depth analysis detailing your home's value as well as a comparison with similar homes in the area
Home Values in the Area
Average Home Value in this Area
Purchase History
| Date | Buyer | Sale Price | Title Company |
|---|---|---|---|
| Ta Tung H | $87,300 | -- |
Source: Public Records
Mortgage History
| Date | Status | Borrower | Loan Amount |
|---|---|---|---|
| Open | Ta Tung H | $65,475 | |
| Closed | Ta Tung H | $17,460 |
Source: Public Records
Tax History
| Year | Tax Paid | Tax Assessment Tax Assessment Total Assessment is a certain percentage of the fair market value that is determined by local assessors to be the total taxable value of land and additions on the property. | Land | Improvement |
|---|---|---|---|---|
| 2025 | $3,875 | $247,100 | $31,500 | $215,600 |
| 2024 | $2,423 | $150,900 | $31,500 | $119,400 |
| 2023 | $2,314 | $135,700 | $28,600 | $107,100 |
| 2022 | $2,716 | $144,300 | $26,700 | $117,600 |
| 2021 | $2,483 | $131,400 | $24,300 | $107,100 |
| 2020 | $2,029 | $103,900 | $24,300 | $79,600 |
| 2019 | $1,980 | $100,600 | $24,300 | $76,300 |
| 2018 | $1,999 | $101,600 | $24,300 | $77,300 |
| 2017 | $1,767 | $89,900 | $22,800 | $67,100 |
| 2016 | $1,596 | $81,200 | $22,800 | $58,400 |
| 2015 | $1,609 | $81,800 | $22,800 | $59,000 |
Source: Public Records
Map
Nearby Homes
Your Personal Tour Guide
Ask me questions while you tour the home.