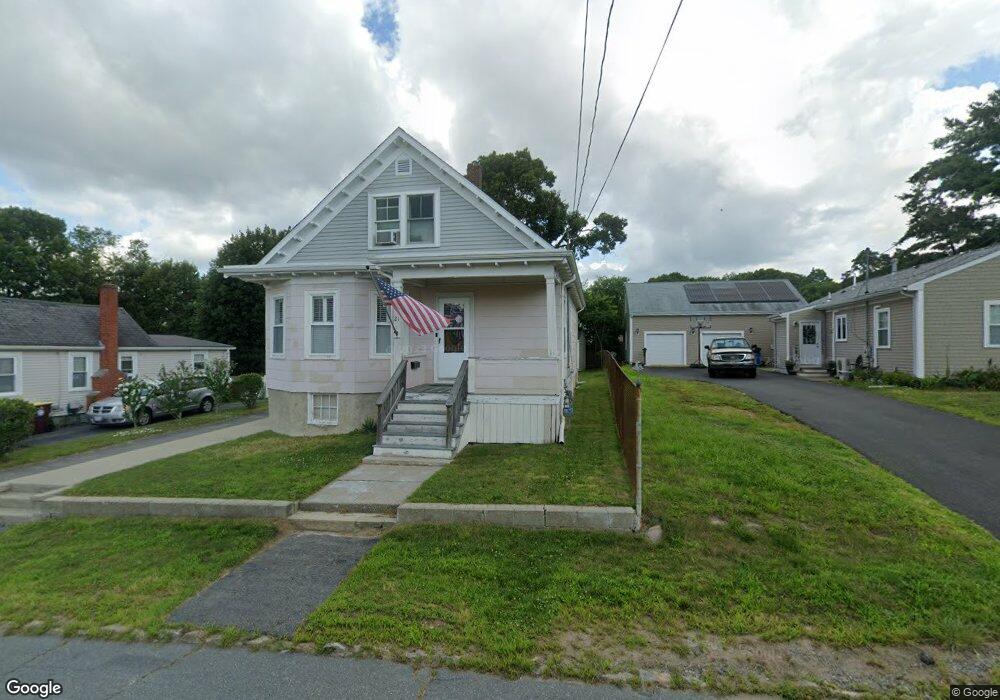
23 Jean St Acushnet, MA 02743
Estimated Value: $450,000 - $510,000
2
Beds
3
Baths
1,676
Sq Ft
$283/Sq Ft
Est. Value
About This Home
This home is located at 23 Jean St, Acushnet, MA 02743 and is currently estimated at $473,560, approximately $282 per square foot. 23 Jean St is a home located in Bristol County with nearby schools including Acushnet Elementary School, Albert F Ford Middle School, and Alma Del Mar Charter School.
Ownership History
Date
Name
Owned For
Owner Type
Purchase Details
Closed on
Oct 28, 2003
Sold by
Lepage Albert A and Mello Claudia
Bought by
Mello Francis L
Current Estimated Value
Home Financials for this Owner
Home Financials are based on the most recent Mortgage that was taken out on this home.
Original Mortgage
$128,000
Interest Rate
6.15%
Mortgage Type
Purchase Money Mortgage
Purchase Details
Closed on
Aug 6, 2003
Sold by
Lepage Joseph He
Bought by
Lepage Albert A and Mello Claudia
Create a Home Valuation Report for This Property
The Home Valuation Report is an in-depth analysis detailing your home's value as well as a comparison with similar homes in the area
Home Values in the Area
Average Home Value in this Area
Purchase History
| Date | Buyer | Sale Price | Title Company |
|---|---|---|---|
| Mello Francis L | $160,000 | -- | |
| Lepage Albert A | -- | -- |
Source: Public Records
Mortgage History
| Date | Status | Borrower | Loan Amount |
|---|---|---|---|
| Open | Lepage Albert A | $174,000 | |
| Closed | Lepage Albert A | $188,000 | |
| Closed | Lepage Albert A | $128,000 |
Source: Public Records
Tax History Compared to Growth
Tax History
| Year | Tax Paid | Tax Assessment Tax Assessment Total Assessment is a certain percentage of the fair market value that is determined by local assessors to be the total taxable value of land and additions on the property. | Land | Improvement |
|---|---|---|---|---|
| 2025 | $41 | $384,400 | $93,100 | $291,300 |
| 2024 | $4,054 | $355,300 | $88,800 | $266,500 |
| 2023 | $3,660 | $305,000 | $80,100 | $224,900 |
| 2022 | $3,544 | $267,100 | $75,800 | $191,300 |
| 2021 | $13,403 | $238,600 | $75,800 | $162,800 |
| 2020 | $3,326 | $238,600 | $75,800 | $162,800 |
| 2019 | $2,964 | $209,000 | $67,100 | $141,900 |
| 2018 | $3,014 | $209,000 | $67,100 | $141,900 |
| 2017 | $2,826 | $195,700 | $67,100 | $128,600 |
| 2016 | $2,886 | $198,600 | $67,100 | $131,500 |
| 2015 | $2,707 | $189,600 | $67,100 | $122,500 |
Source: Public Records
Map
Nearby Homes