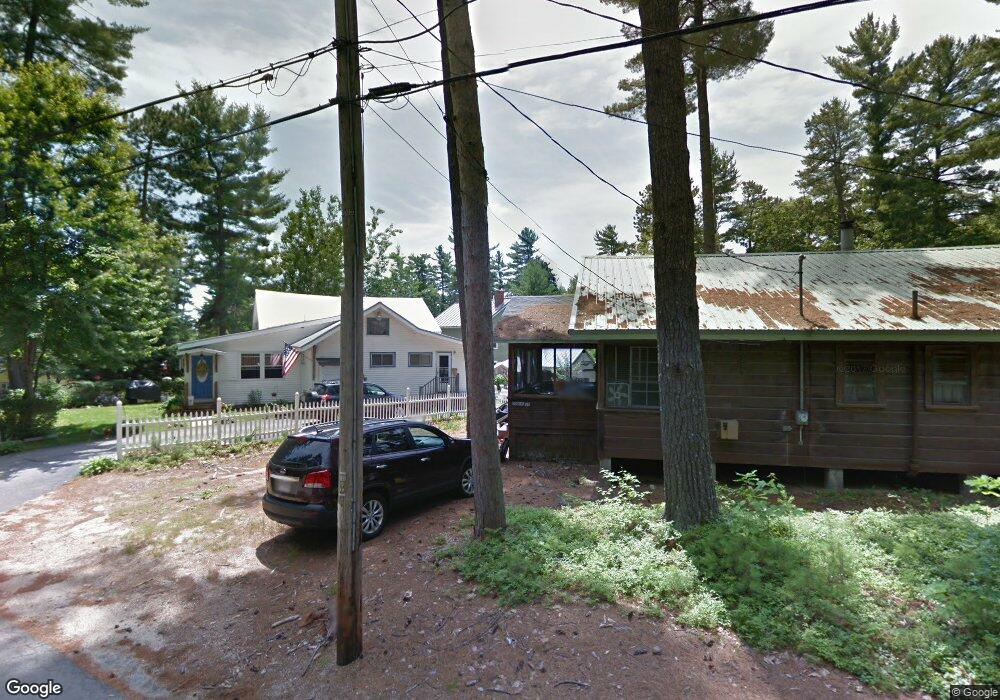
23 Keenan Way Sebago, ME 04029
Estimated Value: $397,722 - $557,000
--
Bed
--
Bath
624
Sq Ft
$757/Sq Ft
Est. Value
About This Home
This home is located at 23 Keenan Way, Sebago, ME 04029 and is currently estimated at $472,181, approximately $756 per square foot. 23 Keenan Way is a home with nearby schools including Lake Region High School.
Ownership History
Date
Name
Owned For
Owner Type
Purchase Details
Closed on
Mar 28, 2024
Sold by
Keenan Ft and Keenan
Bought by
Keenan Sebago Rt and Keenan
Current Estimated Value
Purchase Details
Closed on
Jul 22, 2014
Sold by
Keenan Patrick T and Keenan Nancy P
Bought by
Keenan Edward J
Home Financials for this Owner
Home Financials are based on the most recent Mortgage that was taken out on this home.
Original Mortgage
$156,000
Interest Rate
4.14%
Mortgage Type
New Conventional
Create a Home Valuation Report for This Property
The Home Valuation Report is an in-depth analysis detailing your home's value as well as a comparison with similar homes in the area
Home Values in the Area
Average Home Value in this Area
Purchase History
| Date | Buyer | Sale Price | Title Company |
|---|---|---|---|
| Keenan Sebago Rt | -- | None Available | |
| Keenan Edward J | -- | -- |
Source: Public Records
Mortgage History
| Date | Status | Borrower | Loan Amount |
|---|---|---|---|
| Previous Owner | Keenan Edward J | $156,000 |
Source: Public Records
Tax History Compared to Growth
Tax History
| Year | Tax Paid | Tax Assessment Tax Assessment Total Assessment is a certain percentage of the fair market value that is determined by local assessors to be the total taxable value of land and additions on the property. | Land | Improvement |
|---|---|---|---|---|
| 2024 | $3,969 | $290,963 | $127,000 | $163,963 |
| 2023 | $3,777 | $290,963 | $127,000 | $163,963 |
| 2022 | $3,026 | $290,963 | $127,000 | $163,963 |
| 2021 | $2,866 | $290,963 | $127,000 | $163,963 |
| 2020 | $2,650 | $188,611 | $59,041 | $129,570 |
| 2019 | $2,565 | $188,611 | $59,041 | $129,570 |
| 2018 | $2,480 | $188,611 | $59,041 | $129,570 |
| 2017 | $2,443 | $188,611 | $59,041 | $129,570 |
| 2016 | $2,320 | $188,611 | $59,041 | $129,570 |
| 2015 | $2,396 | $182,897 | $59,041 | $123,856 |
| 2014 | $2,395 | $179,564 | $59,041 | $120,523 |
Source: Public Records
Map
Nearby Homes