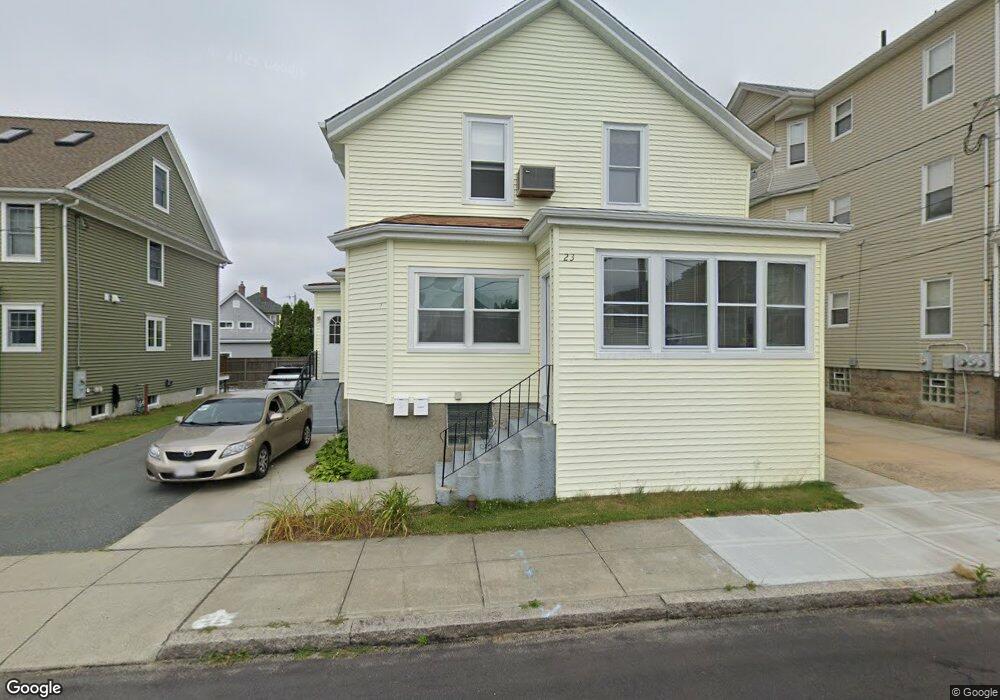
23 Marsh St Fall River, MA 02723
Flint NeighborhoodEstimated Value: $480,000 - $541,000
4
Beds
3
Baths
1,921
Sq Ft
$270/Sq Ft
Est. Value
About This Home
This home is located at 23 Marsh St, Fall River, MA 02723 and is currently estimated at $517,864, approximately $269 per square foot. 23 Marsh St is a home located in Bristol County with nearby schools including Mary Fonseca Elementary School, Talbot Innovation School, and B M C Durfee High School.
Ownership History
Date
Name
Owned For
Owner Type
Purchase Details
Closed on
Oct 3, 2023
Sold by
Saber George
Bought by
Marsh St Rt and Saber
Current Estimated Value
Purchase Details
Closed on
Jan 11, 2013
Sold by
23 Marsh Street Llc
Bought by
Saber George H
Home Financials for this Owner
Home Financials are based on the most recent Mortgage that was taken out on this home.
Original Mortgage
$36,000
Interest Rate
3.36%
Mortgage Type
New Conventional
Create a Home Valuation Report for This Property
The Home Valuation Report is an in-depth analysis detailing your home's value as well as a comparison with similar homes in the area
Home Values in the Area
Average Home Value in this Area
Purchase History
| Date | Buyer | Sale Price | Title Company |
|---|---|---|---|
| Marsh St Rt | -- | None Available | |
| Saber George H | -- | -- |
Source: Public Records
Mortgage History
| Date | Status | Borrower | Loan Amount |
|---|---|---|---|
| Previous Owner | Saber George H | $36,000 | |
| Previous Owner | Saber George H | $53,200 |
Source: Public Records
Tax History
| Year | Tax Paid | Tax Assessment Tax Assessment Total Assessment is a certain percentage of the fair market value that is determined by local assessors to be the total taxable value of land and additions on the property. | Land | Improvement |
|---|---|---|---|---|
| 2025 | $5,015 | $438,000 | $114,600 | $323,400 |
| 2024 | $4,721 | $410,900 | $112,400 | $298,500 |
| 2023 | $4,908 | $400,000 | $101,300 | $298,700 |
| 2022 | $4,367 | $346,000 | $95,500 | $250,500 |
| 2021 | $4,135 | $299,000 | $91,300 | $207,700 |
| 2020 | $4,071 | $281,700 | $87,100 | $194,600 |
| 2019 | $4,059 | $278,400 | $91,000 | $187,400 |
| 2018 | $3,936 | $269,200 | $91,700 | $177,500 |
| 2017 | $3,728 | $266,300 | $91,700 | $174,600 |
| 2016 | $3,537 | $259,500 | $94,500 | $165,000 |
| 2015 | $3,445 | $263,400 | $94,500 | $168,900 |
| 2014 | $3,314 | $263,400 | $94,500 | $168,900 |
Source: Public Records
Map
Nearby Homes
- 580 County St
- 165 Eastern Ave
- 150 Downing St
- 756 County St
- 70 Jencks St
- 178 Thomas St
- 529 Eastern Ave
- 88 Harrison St Unit 5
- 157 Earle St
- 1244 Pleasant St
- 31 Choate St
- 215 Earle St Unit 1
- 219 Earle St Unit 3
- 217 Earle St Unit 2
- 352 Barnes St
- 1155-1157 Pleasant St
- 10 Carlisa Dr
- 129 County St
- 38 Eaton St
- 152 Alden St
Your Personal Tour Guide
Ask me questions while you tour the home.