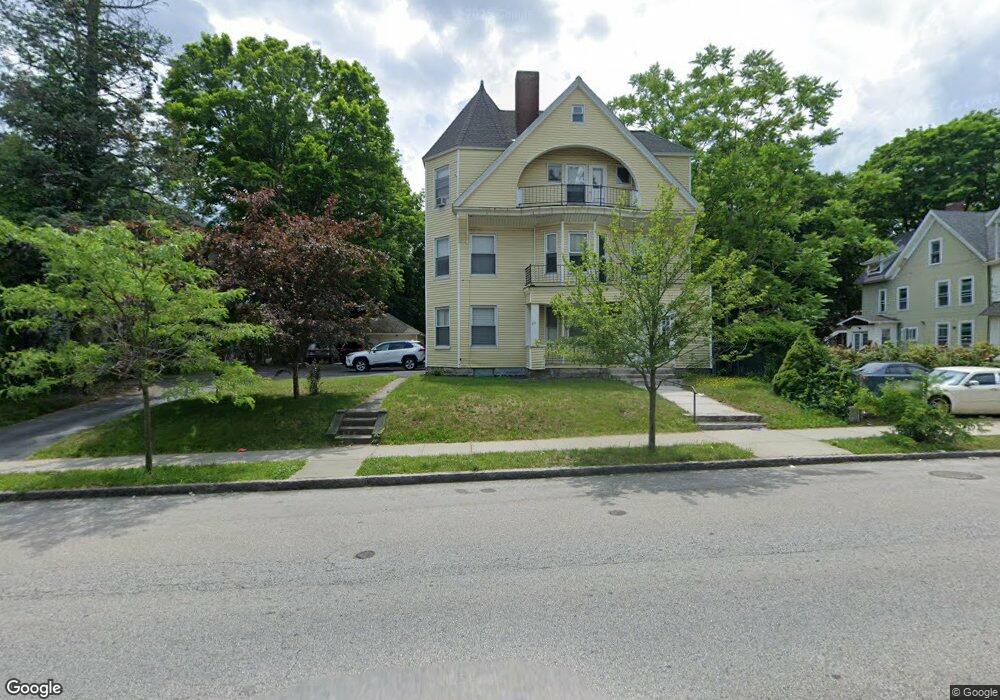
23 May St Worcester, MA 01610
University Park NeighborhoodEstimated Value: $696,000 - $1,124,000
18
Beds
4
Baths
6,800
Sq Ft
$143/Sq Ft
Est. Value
About This Home
This home is located at 23 May St, Worcester, MA 01610 and is currently estimated at $972,333, approximately $142 per square foot. 23 May St is a home located in Worcester County with nearby schools including Jacob Hiatt Magnet School, Chandler Magnet, and Woodland Academy.
Ownership History
Date
Name
Owned For
Owner Type
Purchase Details
Closed on
Sep 15, 2011
Sold by
Tran Rich N and Tran Sandy P
Bought by
Tran Phi and Tran Michelle P
Current Estimated Value
Purchase Details
Closed on
Oct 31, 1997
Sold by
Morrow Josephine M
Bought by
Tran Rich Ngoc and Tran Sandy Phung
Home Financials for this Owner
Home Financials are based on the most recent Mortgage that was taken out on this home.
Original Mortgage
$43,200
Interest Rate
7.31%
Mortgage Type
Purchase Money Mortgage
Purchase Details
Closed on
Apr 12, 1989
Sold by
Tobey Eva P
Bought by
Morrow Josephine M
Home Financials for this Owner
Home Financials are based on the most recent Mortgage that was taken out on this home.
Original Mortgage
$127,000
Interest Rate
10.85%
Mortgage Type
Commercial
Create a Home Valuation Report for This Property
The Home Valuation Report is an in-depth analysis detailing your home's value as well as a comparison with similar homes in the area
Home Values in the Area
Average Home Value in this Area
Purchase History
| Date | Buyer | Sale Price | Title Company |
|---|---|---|---|
| Tran Phi | $200,000 | -- | |
| Tran Rich Ngoc | $54,000 | -- | |
| Morrow Josephine M | $35,000 | -- |
Source: Public Records
Mortgage History
| Date | Status | Borrower | Loan Amount |
|---|---|---|---|
| Previous Owner | Morrow Josephine M | $43,200 | |
| Previous Owner | Morrow Josephine M | $127,000 |
Source: Public Records
Tax History
| Year | Tax Paid | Tax Assessment Tax Assessment Total Assessment is a certain percentage of the fair market value that is determined by local assessors to be the total taxable value of land and additions on the property. | Land | Improvement |
|---|---|---|---|---|
| 2025 | $11,692 | $886,400 | $98,600 | $787,800 |
| 2024 | $10,744 | $781,400 | $98,600 | $682,800 |
| 2023 | $10,331 | $720,400 | $85,700 | $634,700 |
| 2022 | $9,032 | $593,800 | $68,600 | $525,200 |
| 2021 | $8,326 | $511,400 | $54,900 | $456,500 |
| 2020 | $7,676 | $451,500 | $54,500 | $397,000 |
| 2019 | $6,590 | $366,100 | $47,600 | $318,500 |
| 2018 | $6,439 | $340,500 | $47,600 | $292,900 |
| 2017 | $6,054 | $315,000 | $47,600 | $267,400 |
| 2016 | $5,839 | $283,300 | $34,100 | $249,200 |
| 2015 | $5,686 | $283,300 | $34,100 | $249,200 |
| 2014 | $5,536 | $283,300 | $34,100 | $249,200 |
Source: Public Records
Map
Nearby Homes
Your Personal Tour Guide
Ask me questions while you tour the home.