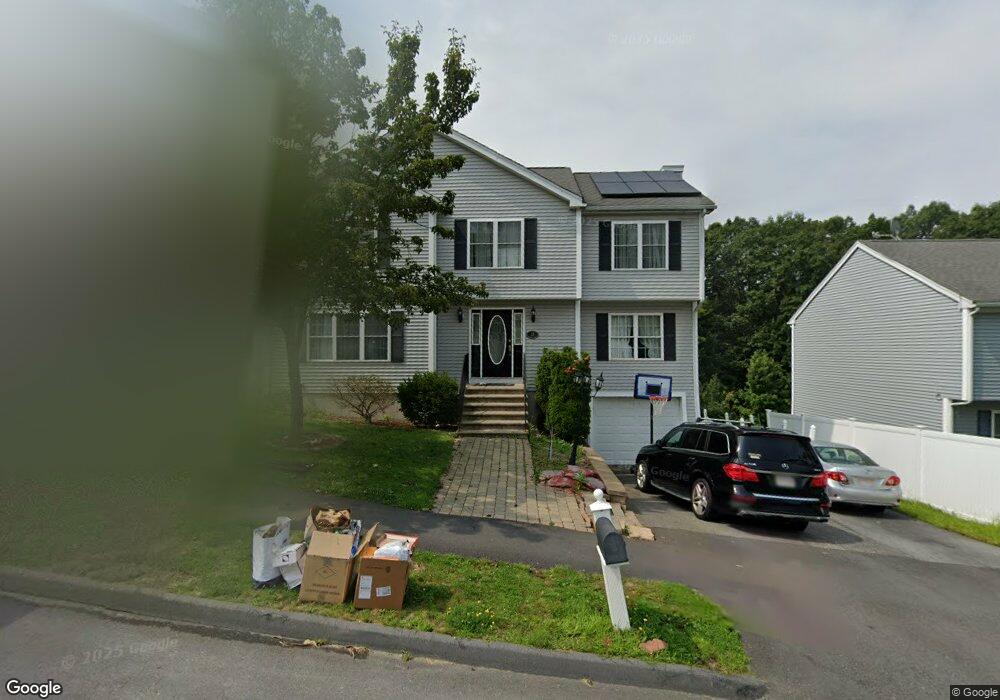
23 Navajo Rd Worcester, MA 01606
Indian Hill NeighborhoodEstimated Value: $619,748 - $657,000
4
Beds
3
Baths
2,322
Sq Ft
$272/Sq Ft
Est. Value
About This Home
This home is located at 23 Navajo Rd, Worcester, MA 01606 and is currently estimated at $630,687, approximately $271 per square foot. 23 Navajo Rd is a home located in Worcester County with nearby schools including Nelson Place Elementary School, Jacob Hiatt Magnet School, and Chandler Magnet.
Ownership History
Date
Name
Owned For
Owner Type
Purchase Details
Closed on
Jan 5, 2010
Sold by
Aweh Gideon
Bought by
Aweh Gideon and Kouassi Adjewa
Current Estimated Value
Home Financials for this Owner
Home Financials are based on the most recent Mortgage that was taken out on this home.
Original Mortgage
$250,150
Outstanding Balance
$163,403
Interest Rate
4.85%
Mortgage Type
Purchase Money Mortgage
Estimated Equity
$467,284
Purchase Details
Closed on
Aug 23, 2004
Sold by
Indian Hills Assoc Inc
Bought by
Aweh Gideon N
Home Financials for this Owner
Home Financials are based on the most recent Mortgage that was taken out on this home.
Original Mortgage
$264,640
Interest Rate
6.03%
Mortgage Type
Purchase Money Mortgage
Create a Home Valuation Report for This Property
The Home Valuation Report is an in-depth analysis detailing your home's value as well as a comparison with similar homes in the area
Home Values in the Area
Average Home Value in this Area
Purchase History
| Date | Buyer | Sale Price | Title Company |
|---|---|---|---|
| Aweh Gideon | -- | -- | |
| Aweh Gideon N | $330,800 | -- |
Source: Public Records
Mortgage History
| Date | Status | Borrower | Loan Amount |
|---|---|---|---|
| Open | Aweh Gideon | $250,150 | |
| Previous Owner | Aweh Gideon N | $264,640 |
Source: Public Records
Tax History Compared to Growth
Tax History
| Year | Tax Paid | Tax Assessment Tax Assessment Total Assessment is a certain percentage of the fair market value that is determined by local assessors to be the total taxable value of land and additions on the property. | Land | Improvement |
|---|---|---|---|---|
| 2025 | $7,144 | $541,600 | $119,400 | $422,200 |
| 2024 | $7,026 | $511,000 | $119,400 | $391,600 |
| 2023 | $6,786 | $473,200 | $103,800 | $369,400 |
| 2022 | $6,364 | $418,400 | $83,000 | $335,400 |
| 2021 | $6,462 | $396,900 | $66,400 | $330,500 |
| 2020 | $6,282 | $369,500 | $66,300 | $303,200 |
| 2019 | $6,307 | $350,400 | $60,000 | $290,400 |
| 2018 | $6,225 | $329,200 | $60,000 | $269,200 |
| 2017 | $5,954 | $309,800 | $60,000 | $249,800 |
| 2016 | $6,074 | $294,700 | $45,500 | $249,200 |
| 2015 | $5,915 | $294,700 | $45,500 | $249,200 |
| 2014 | $5,758 | $294,700 | $45,500 | $249,200 |
Source: Public Records
Map
Nearby Homes