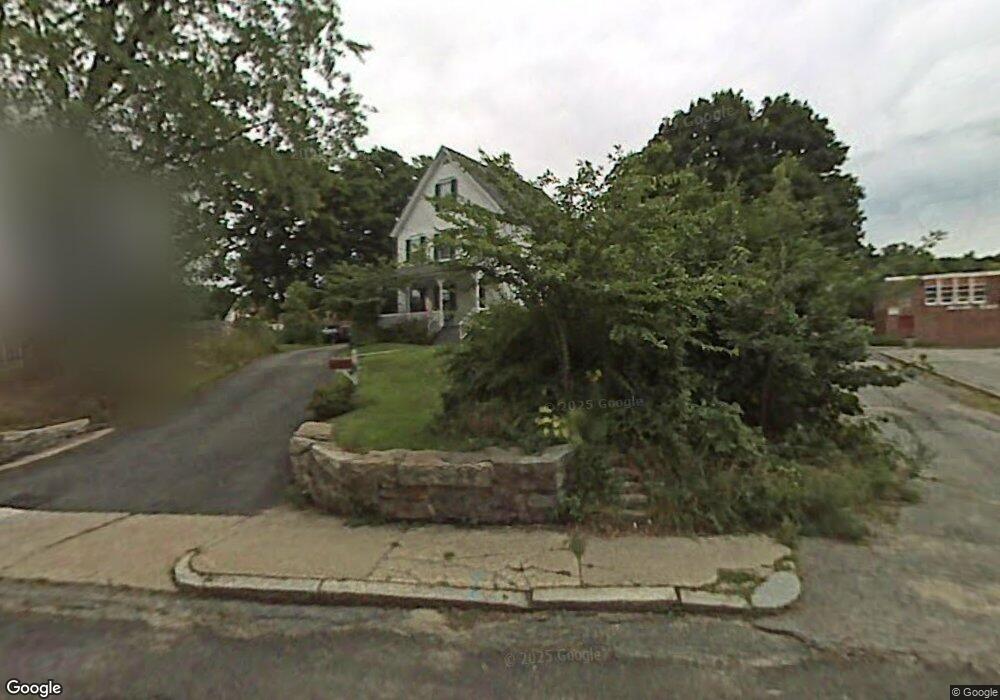
23 Nelson Place Worcester, MA 01605
Forest Grove NeighborhoodEstimated Value: $512,199 - $664,000
7
Beds
2
Baths
2,359
Sq Ft
$248/Sq Ft
Est. Value
About This Home
This home is located at 23 Nelson Place, Worcester, MA 01605 and is currently estimated at $585,550, approximately $248 per square foot. 23 Nelson Place is a home located in Worcester County with nearby schools including Nelson Place Elementary School, Jacob Hiatt Magnet School, and Chandler Magnet.
Ownership History
Date
Name
Owned For
Owner Type
Purchase Details
Closed on
Oct 6, 1998
Sold by
Hapgood Rt and Mcdonald John F
Bought by
Clark John K and Clark Patricia A
Current Estimated Value
Home Financials for this Owner
Home Financials are based on the most recent Mortgage that was taken out on this home.
Original Mortgage
$118,800
Interest Rate
6.89%
Mortgage Type
Purchase Money Mortgage
Purchase Details
Closed on
Jun 3, 1998
Sold by
Whittum Howard S and Whittum Edith S
Bought by
Hapgood Rt and Mcdonald John F
Home Financials for this Owner
Home Financials are based on the most recent Mortgage that was taken out on this home.
Original Mortgage
$250,000
Interest Rate
7.05%
Mortgage Type
Purchase Money Mortgage
Create a Home Valuation Report for This Property
The Home Valuation Report is an in-depth analysis detailing your home's value as well as a comparison with similar homes in the area
Home Values in the Area
Average Home Value in this Area
Purchase History
| Date | Buyer | Sale Price | Title Company |
|---|---|---|---|
| Clark John K | $132,000 | -- | |
| Hapgood Rt | $200,000 | -- |
Source: Public Records
Mortgage History
| Date | Status | Borrower | Loan Amount |
|---|---|---|---|
| Open | Hapgood Rt | $50,000 | |
| Open | Hapgood Rt | $112,000 | |
| Closed | Hapgood Rt | $118,800 | |
| Previous Owner | Hapgood Rt | $250,000 |
Source: Public Records
Tax History
| Year | Tax Paid | Tax Assessment Tax Assessment Total Assessment is a certain percentage of the fair market value that is determined by local assessors to be the total taxable value of land and additions on the property. | Land | Improvement |
|---|---|---|---|---|
| 2025 | $5,776 | $437,900 | $123,800 | $314,100 |
| 2024 | $5,544 | $403,200 | $123,800 | $279,400 |
| 2023 | $5,330 | $371,700 | $106,600 | $265,100 |
| 2022 | $4,946 | $325,200 | $85,300 | $239,900 |
| 2021 | $5,068 | $311,300 | $68,200 | $243,100 |
| 2020 | $4,830 | $284,100 | $68,000 | $216,100 |
| 2019 | $4,747 | $263,700 | $65,700 | $198,000 |
| 2018 | $4,737 | $250,500 | $65,700 | $184,800 |
| 2017 | $4,547 | $236,600 | $65,700 | $170,900 |
| 2016 | $4,775 | $231,700 | $54,500 | $177,200 |
| 2015 | $4,650 | $231,700 | $54,500 | $177,200 |
| 2014 | $4,527 | $231,700 | $54,500 | $177,200 |
Source: Public Records
Map
Nearby Homes
Your Personal Tour Guide
Ask me questions while you tour the home.