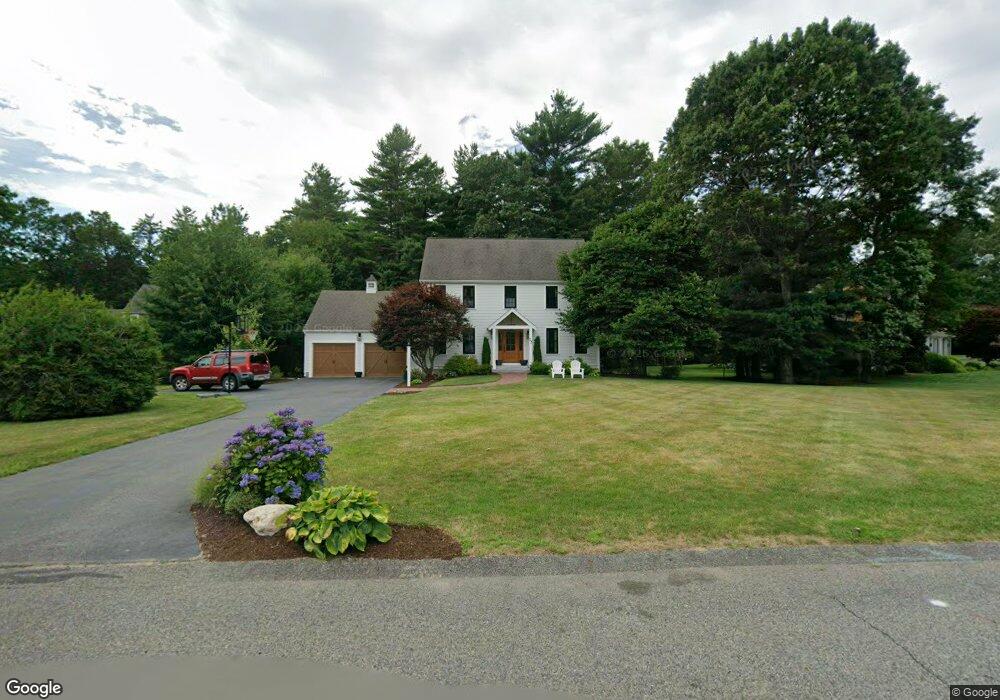
23 Oakland Square Pembroke, MA 02359
Estimated Value: $878,109 - $1,094,000
--
Bed
3
Baths
2,348
Sq Ft
$419/Sq Ft
Est. Value
About This Home
This home is located at 23 Oakland Square, Pembroke, MA 02359 and is currently estimated at $982,777, approximately $418 per square foot. 23 Oakland Square is a home located in Plymouth County with nearby schools including Pembroke High School.
Ownership History
Date
Name
Owned For
Owner Type
Purchase Details
Closed on
May 29, 2020
Sold by
Christiano Michael P and Christiano Teri D
Bought by
M P & T D Christiano Ft
Current Estimated Value
Purchase Details
Closed on
May 17, 2001
Sold by
Robert V Oneill Constr
Bought by
Christiano Michael P and Christiano Teri D
Create a Home Valuation Report for This Property
The Home Valuation Report is an in-depth analysis detailing your home's value as well as a comparison with similar homes in the area
Home Values in the Area
Average Home Value in this Area
Purchase History
| Date | Buyer | Sale Price | Title Company |
|---|---|---|---|
| M P & T D Christiano Ft | -- | None Available | |
| Christiano Michael P | $415,706 | -- |
Source: Public Records
Mortgage History
| Date | Status | Borrower | Loan Amount |
|---|---|---|---|
| Previous Owner | Christiano Michael P | $175,000 | |
| Previous Owner | Christiano Michael P | $115,000 | |
| Previous Owner | Christiano Michael P | $70,000 | |
| Previous Owner | Christiano Michael P | $40,000 |
Source: Public Records
Tax History Compared to Growth
Tax History
| Year | Tax Paid | Tax Assessment Tax Assessment Total Assessment is a certain percentage of the fair market value that is determined by local assessors to be the total taxable value of land and additions on the property. | Land | Improvement |
|---|---|---|---|---|
| 2025 | $9,742 | $810,500 | $340,100 | $470,400 |
| 2024 | $10,031 | $833,800 | $340,100 | $493,700 |
| 2023 | $8,924 | $701,600 | $295,300 | $406,300 |
| 2022 | $8,586 | $606,800 | $245,300 | $361,500 |
| 2021 | $8,451 | $579,600 | $230,100 | $349,500 |
| 2020 | $8,151 | $562,500 | $230,100 | $332,400 |
| 2019 | $7,929 | $543,100 | $225,300 | $317,800 |
| 2018 | $7,853 | $527,400 | $225,300 | $302,100 |
| 2017 | $7,693 | $509,500 | $210,100 | $299,400 |
| 2016 | $7,522 | $492,900 | $195,300 | $297,600 |
| 2015 | $7,180 | $487,100 | $190,100 | $297,000 |
Source: Public Records
Map
Nearby Homes
- 345 Forest St
- 234 Forest St
- 27 Chestnut Rd
- 25 Little Brook Rd
- 32 Little Brook Rd
- 21 Prince Way
- 20 Edward Dr
- 56 & 60 Prince Way
- 61 Chapel St
- 16 Chapel St
- 202 Birch St
- 9 Montclair Ave
- 290 School St
- 628 Center St
- 249 High St
- 820 Center St
- 57 Brandeis Cir
- 600 Summer St Unit 6
- 34 Montclair Ave
- 72 Old Cart Path Ln Unit Lot 2
- 29 Oakland Square
- 17 Oakland Square
- 17 Oakland Square Dr
- 11 Oakland Square
- 35 Oakland Square
- 24 Oakland Square
- 18 Oakland Square Dr
- 30 Oakland Square
- 41 Oakland Square
- 6 Oakland Square
- 169 Plain St
- 175 Plain St
- 3 Oakland Square
- 11 Colonial Way
- 5 Colonial Way
- 163 Plain St
- 8 Colonial Way
- 15 Colonial Way
- 187 Plain St
- 157 Plain St