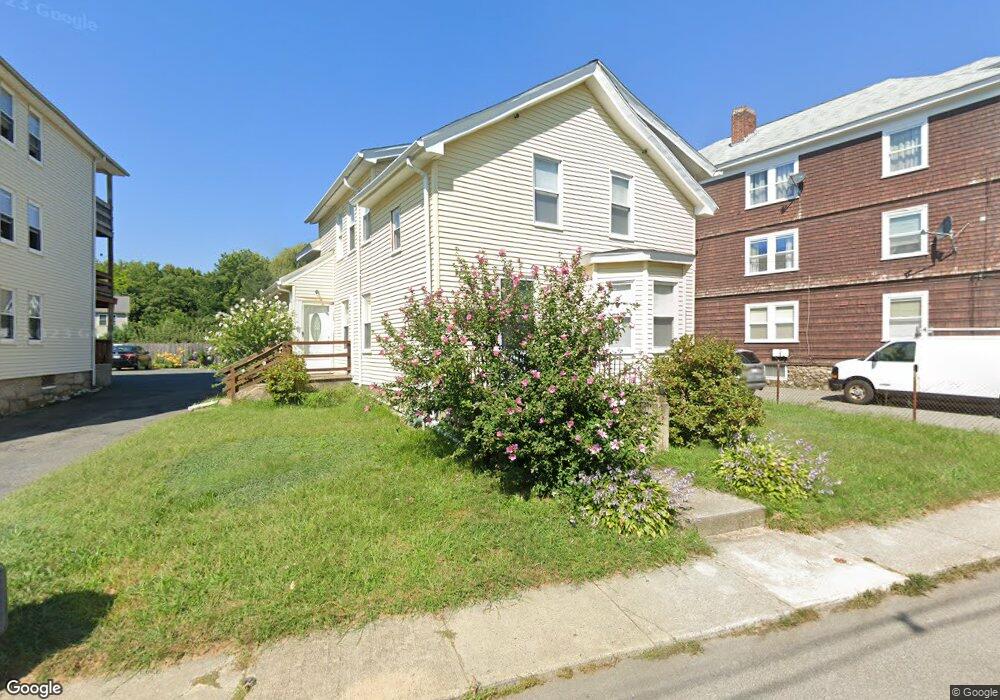
23 Oliver St Milford, MA 01757
Estimated Value: $505,387 - $599,000
6
Beds
2
Baths
2,100
Sq Ft
$260/Sq Ft
Est. Value
About This Home
This home is located at 23 Oliver St, Milford, MA 01757 and is currently estimated at $546,597, approximately $260 per square foot. 23 Oliver St is a home located in Worcester County with nearby schools including Milford High School and Bethany Christian Academy.
Ownership History
Date
Name
Owned For
Owner Type
Purchase Details
Closed on
Jan 22, 2021
Sold by
Longo Jose and Longo Eva V
Bought by
Longo Eva V
Current Estimated Value
Purchase Details
Closed on
Jun 3, 2005
Sold by
Casavant Elizabeth A and Casavant Richard A
Bought by
Longo Eva and Longo Jose
Home Financials for this Owner
Home Financials are based on the most recent Mortgage that was taken out on this home.
Original Mortgage
$160,000
Interest Rate
5.83%
Mortgage Type
Purchase Money Mortgage
Purchase Details
Closed on
May 21, 1999
Sold by
Fhlmc
Bought by
Casavant Richard A and Casavant Elizabeth A
Home Financials for this Owner
Home Financials are based on the most recent Mortgage that was taken out on this home.
Original Mortgage
$73,600
Interest Rate
6.88%
Mortgage Type
Purchase Money Mortgage
Purchase Details
Closed on
Oct 6, 1998
Sold by
Case James G and Homeside Lending Inc
Bought by
Fhlmc
Create a Home Valuation Report for This Property
The Home Valuation Report is an in-depth analysis detailing your home's value as well as a comparison with similar homes in the area
Home Values in the Area
Average Home Value in this Area
Purchase History
| Date | Buyer | Sale Price | Title Company |
|---|---|---|---|
| Longo Eva V | -- | None Available | |
| Longo Eva | $349,900 | -- | |
| Casavant Richard A | $81,800 | -- | |
| Fhlmc | $116,795 | -- |
Source: Public Records
Mortgage History
| Date | Status | Borrower | Loan Amount |
|---|---|---|---|
| Previous Owner | Longo Eva | $160,000 | |
| Previous Owner | Fhlmc | $90,000 | |
| Previous Owner | Fhlmc | $73,600 | |
| Previous Owner | Fhlmc | $114,800 |
Source: Public Records
Tax History Compared to Growth
Tax History
| Year | Tax Paid | Tax Assessment Tax Assessment Total Assessment is a certain percentage of the fair market value that is determined by local assessors to be the total taxable value of land and additions on the property. | Land | Improvement |
|---|---|---|---|---|
| 2025 | $5,421 | $423,500 | $149,500 | $274,000 |
| 2024 | $5,285 | $397,700 | $142,500 | $255,200 |
| 2023 | $4,852 | $335,800 | $119,900 | $215,900 |
| 2022 | $4,732 | $307,500 | $109,500 | $198,000 |
| 2021 | $4,457 | $278,900 | $109,500 | $169,400 |
| 2020 | $10,066 | $273,100 | $109,500 | $163,600 |
| 2019 | $3,984 | $240,900 | $109,500 | $131,400 |
| 2018 | $3,623 | $218,800 | $104,300 | $114,500 |
| 2017 | $3,511 | $209,100 | $104,300 | $104,800 |
| 2016 | $7,638 | $198,500 | $93,900 | $104,600 |
| 2015 | $3,349 | $190,800 | $90,400 | $100,400 |
Source: Public Records
Map
Nearby Homes
- 19 Oliver St
- 318 Main St
- 6 1/2 Leonard St
- 6 Correia Cir Unit B
- 9 Ariana Cir Unit 9
- 20-22 Chapin St
- 7 Ariana Cir Unit 7
- 10-12 Orchard St
- 33 Chestnut St
- 59 Lawrence St
- 116 Adin St
- 7 Madden Ave
- 29 Forest St
- 106 Adin St
- 48 Claflin St
- 56 S Bow St
- 102-104 Central St
- 30 Whitney St
- 55 Jefferson St
- 7 Highland St
- 25 Oliver St
- 21 Oliver St
- 21 Oliver St Unit 2
- 27 Oliver St
- 27 Oliver St Unit a
- 2 Farese Rd
- 29 Oliver St
- 22 Oliver St
- 4 Farese Rd
- 4 Farese Rd Unit 3
- 24 Oliver St
- 30 Taylor St
- 31 Oliver St
- 31 Oliver St Unit 8
- 31 Oliver St Unit 4
- 31 Oliver St Unit 3
- 15 Oliver St
- 28 Oliver St
- 19 Farese Rd Unit 19
- 19 Farese Rd Unit Left side